Help - Search - Members - Calendar
Full Version: Philae landing on the nucleus of Comet 67P C-G
Unmanned Spaceflight.com > Other Missions > Cometary and Asteroid Missions > Rosetta
Pages: 1, 2, 3, 4, 5, 6, 7, 8, 9, 10, 11, 12, 13, 14, 15, 16, 17, 18, 19, 20, 21, 22, 23, 24, 25, 26, 27, 28, 29
Brian Lynch
QUOTE (Siman @ Nov 27 2014, 09:16 AM) *
...it is essential to have picture of comet 3D shape model with single line representing Sun position on 13. Nov 2014. 06.20.22 UTC.


The sun vector is defined as follows in terms of the comet coordinate frame at that date and time:

az = -40.1158 deg
el = 37.1491 deg

...or with this unit vector (also in the 3D model coordinate frame):

[0.6096, -0.5136, 0.6039]

QUOTE (jmknapp @ Nov 27 2014, 02:12 PM) *
Thanks--so that's basically longitude and latitude, right?


Yes, sorry for the confusion. Azimuth is the longitude (positive east) and elevation is the latitude (positive north). This applies to the above sun vector, too.
Brian Lynch
Attached are a couple of figures showing the sun position in the rotating comet frame (longitude and latitude). As expected, the latitude is essentially constant during each rotation but slowly drifts due to the seasonal variation.
Malmer
Brian.

Awesome stuff.

I really need to get started with spice kernels. Do I need matlab or is there some other (perhaps even free) software that can process spice. Where can i find the data? Documentation?

Should there be a section on the forum for spice kernlery perhaps?
Brian Lynch
All the SPICE data is available here: ftp://ssols01.esac.esa.int/pub/data/SPICE/ROSETTA/kernels/

(There is also a NASA FTP site with the same data.)

I like to use AGI's Satellite Tool Kit, which is available for free with many features and has a great GUI and 3D graphics window. Of course that also comes with a learning curve, but I'm happy to provide help there. The nice thing about STK is that you can create reports in .csv format to export all kinds of data in various frames (ie. sun vector from a particular spacecraft) without having to do much more than click a couple of buttons.

I've recently started using the MATLAB tool kit for SPICE, and there are toolkits for other languages too (http://naif.jpl.nasa.gov/naif/toolkit.html). MATLAB does require a license but there is an open-source version called Octave that has been designed to use the same functions and syntax, allowing MATLAB programs to be run with little or no editing -- I haven't tried it but a colleague of mine has had success with it and you might be able to run the SPICE toolkit with no problems.

All that said, I could also simply extract important data and post it in a spreadsheet format.
Brian Lynch
QUOTE (aholub @ Nov 26 2014, 04:55 AM) *
Brian, your simulation is very interesting, very nice and very promising. I think that you can quietly adjust the direction of the initial vector, because we do not know it well enough. I suppose that impact points then can be very close to the yellow area from the CONSERT measurements.

How high are the jumps? From the picture I estimate less than 500 meters, which would be consistent with my expectations.


Sorry I never replied to this! The jumps peak around 300-400 meters -- I'll post some more detailed results shortly.

I've been working on the initial conditions for the bounce and realized my assumptions about the apparent direction in the sequence of OSIRIS images is very wrong. I was estimating the initial direction by essentially assuming that the camera was looking directly down at the ground, while in fact Rosetta is passing by north of Philae and not looking directly down when those images were captured.

The angle between the local surface normal at the initial touchdown location and a vector pointing to Rosetta is about 21 deg. The resolution of the OSIRIS image is 0.28 m/pixel, so that means for every meter of altitude Philae has, there is about a 10 pixel offset between its projected location seen in the image and its actual ground-track location directly along the nadir. Most of my simulations place Philae with at least 75 m altitude at 15:43, even with low climb rates (it is in fact over a depressed region that stands out well in Mattias' landing site 3D model). That suggests the actual point on the ground directly under Philae is 750 pixels away from the apparent location.

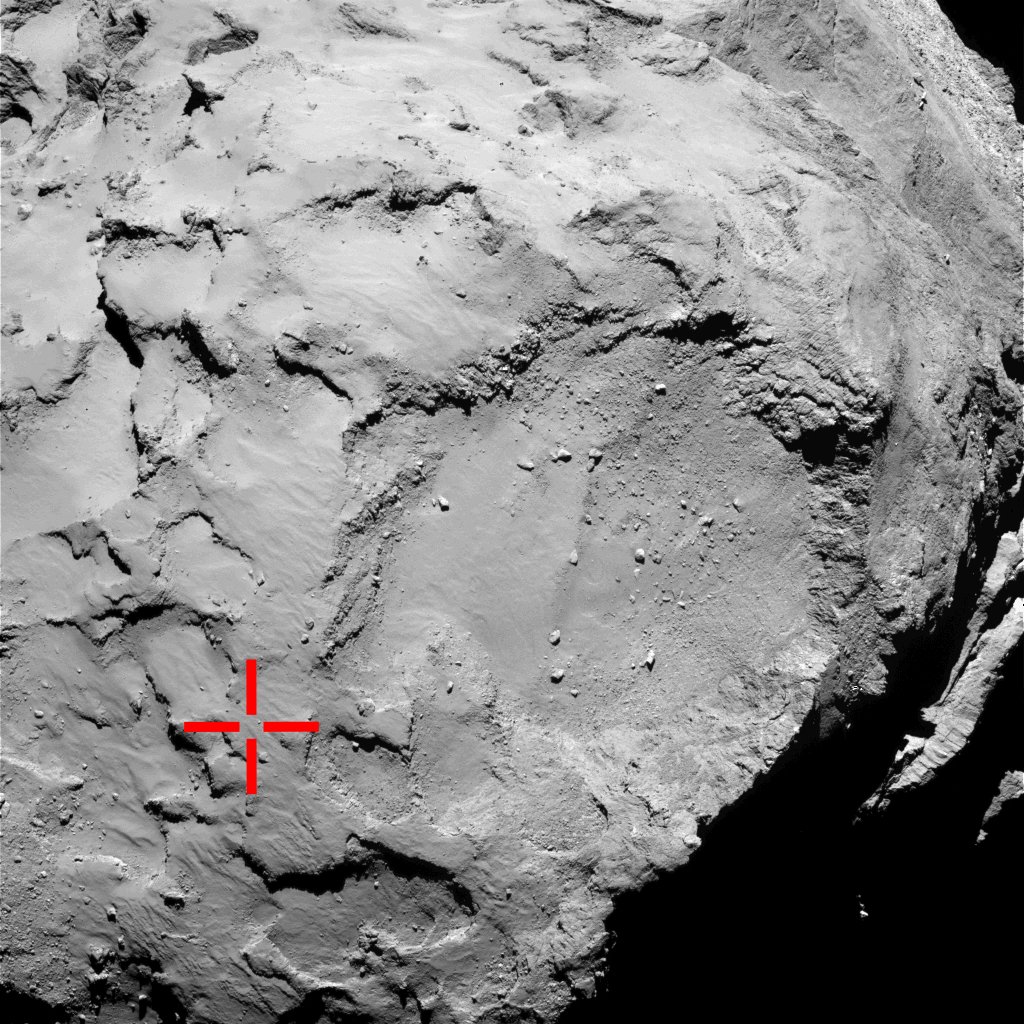
Attached is the OSIRIS sequence image overlaid on top of the "First Touchdown" image (you can see the red crosshair mostly covered), where the 750 pixel radius circle is included as well as a red arrow indicating a rough estimate of the direction towards Rosetta -- if you could drop a laser pointer directly down to the comet from Philae it should strike the ground somewhere on this circle, likely at the angular location where the red arrow points. Of course this is a very rough calculation, but kind of sheds some light on the initial conditions of the bounce.

What about the other images capturing Philae before touchdown? That's complicated as seen in the other attached figures, where the plots show the relative trajectories for Rosetta (red) and Philae (blue), as well as Philae's ground-track (yellow), vectors from Rosetta to Philae at the time of each image (red), and drop lines from Philae to the actual location directly below (magenta)...

PaulH51
Did Philae graze a crater rim during its first-bounce?

Blog report from ESA [LINK]

Paolo
meanwhile, Philae appears to have hit something during its flight between the 1st and 2nd landing, that changed its spin rate: http://blogs.esa.int/rosetta/2014/11/28/di...s-first-bounce/
Malmer
QUOTE (Brian Lynch @ Nov 28 2014, 11:39 AM) *
Sorry I never replied to this! The jumps peak around 300-400 meters -- I'll post some more detailed results shortly.

I've been working on the initial conditions for the bounce and realized my assumptions about the apparent direction in the sequence of OSIRIS images is very wrong. I was estimating the initial direction by essentially assuming that the camera was looking directly down at the ground, while in fact Rosetta is passing by north of Philae and not looking directly down when those images were captured.

The angle between the local surface normal at the initial touchdown location and a vector pointing to Rosetta is about 21 deg.

I tried to calculate that vector by reverse-engineering the viewing geometry of the picture using my terrain-model as survey data to a camera matching software. But since the OSIRIS frame was part of a mosaic there was considerable uncertainty on as to how the original frame was formatted.

To build the initial throw direction vector I used the navcam gif animation. Even greater uncertainty in viewing geometry here because of its very tight cropping and unknown image registration. But having both the philaes shadow and philae in frame still locks down the possible directions.

(you can see the vector intersection between sun-vector and view-vector in my animation)

Replacing my crapulent homebrewn viewing geometry data with awesome spice goodness would create a much much better simulation.

I believe that if we where using my terraindata and your SPICE data and gravity simulation we should be able to lock down the impact area really really well.
scalbers
By analogy to this paper on comet Holmes (and various spacecraft comet closeups), we can consider that as the coma activates its optical depth will increase enough to scatter some light into the shadows. We can already see the coma better now at lower phase angles from Rosetta. This might be somewhat noticeable in the solar panel illumination as time goes on.

http://arxiv.org/pdf/1210.2764v1.pdf

So we can even try to simulate the sky brightness (and Malmer's depth cues) seen from Philae from this scattering.
4th rock from the sun
QUOTE (Paolo @ Nov 28 2014, 01:03 PM) *
...appears to have hit something during its flight between the 1st and 2nd landing, that changed its spin rate...


Great results from the magnetometer readings.
So we may have 4 contacts with the surface, all with at least one of the landing legs, none with the probe's main body.
I guess it will also induce some more shifts into the landing trajectory.
centsworth_II
Wow, clipping the crater rim! What a thrill ride, and in dramatic real time slow motion. Philae - the movie is really going to be something when it finally comes out. Twists, tumbles, collisions... no Hollywood stunt director could outdo all that. And to come out in the end, "just doing my job", that's a real action hero!
fredk
Wow indeed!

And, given the background magnetic field, the magnetometer readings post first bounce should hopefully allow them to reconstruct the phase of the rotation, ie the actual lander orientation, up to the second contact. Although without a clear signal for the moment of second contact, it probably would be hard to know the orientation at the moment of second contact (ie which leg made contact).

But if the phases (not just the frequencies) of the rotation about each axis can be reconstructed post-second bounce, we could also reconstruct the tumbling motion, which via dynamics should tell us something about what happened at second contact. In principle I could imagine an animated reconstruction of the landing drawing from the various information we have...

As 4th rock mentioned, it's possible this second contact had a significant effect on the trajectory, so unfortunately any trajectory modelling will only be valid to that point. But with a lot of luck, precise trajectory modelling might tell us where to look for the second contact, and we may spot a fresh contact mark in OSIRIS imaging...
SteveM
QUOTE (fredk @ Nov 28 2014, 01:30 PM) *
And, given the background magnetic field, the magnetometer readings post first bounce should hopefully allow them to reconstruct the phase of the rotation, ie the actual lander orientation, up to the second contact.


Could the engineering data from the solar panels provide a check on the magnetometer data? If it was sampled rapidly it could provide a direct estimate; if samples are less frequent, the data points could be fit to the period established by the magnetometer data ( something analogous to plotting asteroid light curves, but with inderpendent data for all sides and the top of Philae).
4th rock from the sun
From memory, I think the panels are sampled every 2 minutes. At least that was mentioned regarding detecting surface shadow movement during the day.
Gerald
A processed version (averaging perpendicular to the diagonal stripes (over 3 pixels iirc), point-noise filtering (over three pixels only), blur radius 0.1 pixels, non-linear contrast-enhancement, sharpening) of the Civa-P panorama 1, camera 6 image:
Click to view attachment
Most of the pore-like appearing dots are too close to the resolution of the processing to be sure, whether it's actually pores or processing artifacts.

I've also tried to clean the raw image from the diagonal stripes without loss of data, but I wasn't happy with the results thus far.
Brian Lynch
Oh boy, that little bump definitely makes reconstruction harder. They talk about it as a change in spin and mention that no vertical deceleration was detected but I suspect that the forward speed probably dipped at least a little bit. What I find a bit confusing is the 16:20 timestamp for this event. The duration between the initial touchdown and the second touchdown is something like 6682 seconds, and the crater tip occurs at 2760 seconds.

Based on my simulation results, both the fact there was a tip at all and the time it occurs suggest Philae took a really shallow trajectory across that big crater feature. I'd hypothesize that maybe this contact occurred with that very crater rim, but the final landing spot is estimated to be just beyond it and means it would have to speed over and hit the rim after 2760 s, then slow down significantly and spend 3922 s slowly drifting down to the second touchdown location... and that doesn't really make sense.

It almost seems as if it took a shallow trajectory and hit some feature in the middle of that big crater then continued on over the rim.

QUOTE (Malmer @ Nov 28 2014, 08:47 AM) *
I believe that if we where using my terraindata and your SPICE data and gravity simulation we should be able to lock down the impact area really really well.


Agreed, your landing site model is awesome, do you have one that extends further over the big crater rim? I'll put together a spreadsheet of the position and velocity of Rosetta, Philae, and 67P-C/G so you don't have to dig into the SPICE kernels.
Malmer
QUOTE (Brian Lynch @ Nov 29 2014, 03:10 AM) *
the crater tip occurs at 2760 seconds.


ok... I know my gravity simulation and vectors and all that are not the greatest... but at exactly 2760 seconds into my animation i pass within 50 meters from this cliff...

Click to view attachment

My parabola has always been very shallow. It has to be. The intersectionpoint between philae and philaes shadow in the first navcam image is really close to the ground. my sunvector at the time was fairly good. (give or take 5 degrees or so)
my vieving geometry might have had like 15-20 degrees error. but that does not make much difference in the elevation of the initial throw vector. perhaps 5-10 degrees or so.

Regardless of pointing it still comes down to speed. And the time between the touchdown and that navcam image is very well constrained so the speed of philae is very exactly defined there. And that "mountain" it is pretty much the only place that there is to hit at that speed after that time... everything else is just open space...


wider view:
Click to view attachment

if it hit that it would have lost a bit of speed and bounced inwards and that would have made it end up in the search area.

Malmer
My model is not great on the other side of the rim. There has been very little coverage from that direction. The neck area is never imaged from that side for instance. I think there might be major science happening on that side smile.gif

Crappy side____________________Pretty side
Click to view attachmentClick to view attachment
scalbers
Great simulations. This makes sense now in explaining how Philae could have had a fairly high initial bounce speed and yet not travel too far ultimately. Good save by the crater rim.
Brian Lynch
Nice, those results look great! Maybe we can then simulate starting from the proposed contact point where velocity could be computed assuming a perfect rebound with respect to the surface normal.

You mentioned before that your simulation simply uses an inverse-square law, but are you also accounting for the comet rotation? It isn't hard to have your model rotate while simulating in the inertial frame, but the trick is getting those initial conditions worked out in the inertial frame. You could also check how the simulation compares to the planned trajectory up until the first touchdown, which I believe was followed almost exactly.

Are you using an arbitrary coordinate frame or do you have that surface model cast in the same frame as the ESA .obj file? Either way, I'd love to get my hands on it! Here are links to text files with the position and velocity of Rosetta, Philae, and 67P-C/G (starts just before Philae separation from Rosetta and lasts 2 days... I can post more if requested).

67P-C/G Position & Velocity
Rosetta Position & Velocity
Philae Position & Velocity

Also, here is the sun vector with respect to the comet frame:

Sun Vector from 67P-C/G

Note that the position/velocity data is presented in the J2000 frame, where the origin is Earth (the sun vector is with respect to the comet, but in the J2000 coordinate frame). Simply subtract the states 67P-C/G from those of Rosetta and Philae to get the relative motion.

The comet orientation state with respect to the J2000 frame is provided in this file (roll-pitch-yaw):

67P-C/G Rotation

However, time needs to be computed based on the start and stop times given in the file... all the data is presented in 1 second steps but there is an 8.5 hour offset for the sun vector data points -- or 30600 in terms of the indices.
pac56
There was an OSIRIS-NAC photo session November 24th from the 30 km orbit to image Philae's last resting place. Results are expected soon. There will be a 2nd OSIRIS-NAC photo session on December 6th from a 20 km orbit. Chances are considered good for the 2nd session to image Philae. CNES
Malmer
QUOTE (Brian Lynch @ Nov 29 2014, 04:38 AM) *
Nice, those results look great! Maybe we can then simulate starting from the proposed contact point where velocity could be computed assuming a perfect rebound with respect to the surface normal.

You mentioned before that your simulation simply uses an inverse-square law, but are you also accounting for the comet rotation? It isn't hard to have your model rotate while simulating in the inertial frame, but the trick is getting those initial conditions worked out in the inertial frame. You could also check how the simulation compares to the planned trajectory up until the first touchdown, which I believe was followed almost exactly.

Are you using an arbitrary coordinate frame or do you have that surface model cast in the same frame as the ESA .obj file?


I do not really think we can expect to do much of an specific simulation after that point. One could of-course eject massive amounts of plausible parabolas from there to create a map of probable landing areas. There must be areas that cannot be reached from there and so on...

My comet is aligned as the ESA model and it is rotating at the 12hr rate. (My voxel gravity model is spinning with it)

My philae model (the sphere) is ejected from the first touchdown point so that it intersects the philae philae-shadow intersection point at the correct time. (that gives it its speed and direction) then it is all up to the inverse square stuff...


Gerald
QUOTE (Brian Lynch @ Nov 29 2014, 04:38 AM) *
Maybe we can then simulate starting from the proposed contact point where velocity could be computed assuming a perfect rebound with respect to the surface normal.

The rotation reduced from 1/(13s) to 1/(24s), hence almost 3/4 of the rotational energy and almost half of the rotational momentum has been lost during the touch. This could be used to infere velocity change, assuming perfect elastic collision and no energy loss by friction.
The amount of tumbling after touch could also be considered to infere properties of the bouncing.
To do meaningful calculations you need the mass distribution of the lander.
After that one could play with the assumptions (some plasticity of the collision (damping), and some kinetic energy loss (translation and rotation) by kinetic friction) to get a family of trajectories and potential 2nd touchdown positions.
The time between touch and 2nd touchdown could be used to constrain the family of trajectories.

But that's a lot of work. I'd think OSIRIS will succeed faster.
Malmer
Given the uncertainty in the initial speed and drirection of the first bounce, the uncertainty of the global orientation and center of our shapemodel. The local uncertainty of the terrainmodel, the orientation spin and mass distribution of the lander and so on I think we might aswell just guess smile.gif

But it would be worthwile to try to pin down the area where that touch happened. There might be some fresh material excavated there.

My attempts of finding the actual lander using physics end here. I am really happy with My results. I think I have a very plausible trajectory from touchdown untli the crater wall impact.

I'm going back to the CIVA pano. I will try to refine my depth estimates and use them to build a little pizza slice of a 3d landscape. Then perhaps I could try to see if it matches something out there. Low chance of success. But doable.

Brian Lynch
QUOTE (Malmer @ Nov 29 2014, 04:43 AM) *
My comet is aligned as the ESA model and it is rotating at the 12hr rate.


Ok nice, I downloaded it from your blog and there is an offset from the SPICE touchdown position similar to the ESA model -- this could be due to an offset for the CG, orientation, scale, or a combination (see attached, where the red line is Philae's trajectory in the rotating frame and the red X is a rough estimate of the landing site based on comparison with the inset figure).

Do you use the z-axis for the rotation? (what I assume for the ESA model)

QUOTE (Gerald @ Nov 29 2014, 08:09 AM) *
This could be used to infere velocity change...

But that's a lot of work. I'd think OSIRIS will succeed faster.


I suppose you could try to compute the impulse required to generate that change in angular momentum based on the CAD model. They do say the lander was spinning along its z-axis only prior to the collision and if we can estimate the spin axis afterwards then it might be possible to make an educated guess where the impulse was applied and in what direction.

Hopefully OSIRIS images reveal the true location and we can use that to more easily reconstruct the trajectory. Even better would be fresh SPICE data from ESA showing their reconstruction.
scalbers
QUOTE (Brian Lynch @ Nov 27 2014, 08:40 PM) *
Attached are a couple of figures showing the sun position in the rotating comet frame (longitude and latitude).

Let's see if I understand Brian's interesting plots in general terms. The time of the Philae pan would be 0620UTC. Is this Earth Received Time or event time for Philae? The blue line at 0620 UTC on the solar longitude (at 22800s) would look like a positive longitude of 35-40 degrees. Brian implies in this post the west longitude is 40.2 degrees, though it makes more sense to me to consider this east longitude. This number decreases with time as the sun moves west in the sky. At this cometographic longitude it would be local noon. The intended equatorial landing site was near 0 longitude, and the actual is estimated maybe 20 degrees or so (in terms of local surface orientation - cometographically) to the east and still on the equator. The hour angle of the sun then during the panorama is -20.2 degrees. This would be in the late morning (Earth equivalent of 10:39am local solar time), and the sun would be reasonably close to what is marked in the pan I posted earlier to match the diurnal arc, though would have to be shifted slightly leftward and upward to match exactly. Conversely, the longitude of the landing site could be a little more to the west where it would be earlier in the morning. Fairly consistent overall - any ideas to refine these estimates?
Malmer
The model on my blog is probably not oriented or scaled at all. It is an older mesh.
Siman
Still, it might be interesting to calculate approximate impact point with the crater wall, and then use available pictures to infer local, or at least general wall angle in that area. Maybe it could be possible even without full trajectory simulation which take into account comet irregular shape. We have two pictures with Philae after the moment of first touchdown. First one, pixel and its shadow, and the second, Philae on the dark background. First rebound trajectory must be in, or at least near the plane that contain center of gravity and first touchdown point. We also have two projections of lander as they appear from Rosetta point of view. We know Rosetta position and we know angle of the Sun. That is enough to constrain family of planes defined by two points to a single one. Duration of the first rebound trajectory was 45' 56''. In that time comet rotation angle was (46/(12.4*60))*360=22 degrees. If we rotate comet for 22 degrees, we get single short line segment as the intersection of first rebound plane and crater wall. Hopefully, general slope of that wall will not change much in the neighborhood, and that may account for approximation errors, if we consider elastic rebound and count on some luck. At very least we would know where to look for impact mark on the wall.


Brian Lynch
QUOTE (scalbers @ Nov 29 2014, 10:03 AM) *
...any ideas to refine these estimates?

Here are some figures describing the sun vector for a region approximating the estimated final landing site.

The first figure shows the region (in cyan) along with the local coordinate frame (zenith-east-north in red-green-blue) and sun vector from the middle of that region in yellow (the dotted line is the sun vector projected onto the local east-zenith plane).

The second figure is the apparent azimuth and elevation of the sun (essentially NW at an angle of around 28 deg above the horizon) and the third figure shows the region in the sky where the sun should be located based on the variation in the local frame across the landing site region.

QUOTE (Malmer @ Nov 29 2014, 10:12 AM) *
The model on my blog is probably not oriented or scaled at all. It is an older mesh.

Ah ok, any chance you can post the latest version? I'd love to get it with the texture too then hopefully import it into STK for visualizations.
scalbers
Thanks much Brian for posting these figures. I can try to fit this solar position to the pan, even though it is in the afternoon instead of morning as I suggested 4 posts back. I suppose this means the sun was in fact at 40.2 west longitude and is lower (down from 47 to 28 degrees altitude) along the left portion of the diurnal arc. It's a bit of a different and maybe challenging scenario to get a solution with the sun that low in the NW sky. For instance it suggests there is much more morning and noon sun on Philae (with the tilt angle increased from 70 to 85 degrees). In the test image below, solar panels #1 and #2 are marked in green below and above the diurnal arc respectively. The location of the sun (Malmer's XYZ vector) is marked right near the diurnal arc valid for the equator on CG. I'm unsure now how this squares with 4th Rock's solar panel data.

Click to view attachment
Gerald
An attempt to process the Civa camera 5 image of pano 1:
Click to view attachment
It's upside-down, since the light seems to come from a direction making it easier for my brain to find sense after turning the image that way.
I tried to take into account, that brighter parts of the raw image have higher S/N than darker parts, hence superposed different filterings for brighter and darker regions.
4th rock from the sun
QUOTE (scalbers @ Nov 29 2014, 07:07 PM) *
I'm unsure now how this squares with 4th Rock's solar panel data.


My diagram has no tilt (craft perfectly horizontal) and is very approximate.
If you shift your landscape to the other side of arc, (meaning that the sun in near the clear sky image) and remove the horizon tilt, it will match.

Something like this:
Click to view attachment

I think there should be some small tilt to better match the sun position and shadows. But something gentle, about ~10º perhaps, with the west titled up.
4th rock from the sun
QUOTE (Gerald @ Nov 29 2014, 02:07 AM) *
A processed version ... Civa-P panorama 1, camera 6 image[/url]:


My source file for that image is named: p11557_6924652cfdee8940f73557d681f871fb20141113_CIVA6-7_PANO1-620
So you have two images there. Camera 6/7 is stereoscopic rolleyes.gif
At least I see double features there. Your processing has made that clearer.
Gerald
I'm inclined to say, that the double features are real.
A superposed stereo image would probably be more obvious, more like this:
Click to view attachment
Maybe the camera 7 image isn't published yet.
Malmer
QUOTE (Gerald @ Nov 30 2014, 01:52 AM) *
It's upside-down, ...


that light must be reflected light from somewhere. Because the "raw" image is clearly not upside down. You see the lander foot in frame.

I would really like to see the image from the ROLIS camera in this location. I wonder what that shows.
4th rock from the sun
There are a lot of reflections on all images. That might somewhat explain the distance shadowing noticed before.

I balanced the light levels, using the lighted landing pads as reference.
Click to view attachment

The reflection on the cliff to the left obvious (but dark on this version of the image). But to the right it also appears to be some extra illumination.
Anyway, the released half resolution and already stretched frames are not ideal for this analysis.
scalbers
QUOTE (4th rock from the sun @ Nov 30 2014, 01:53 AM) *
I think there should be some small tilt to better match the sun position and shadows. But something gentle, about ~10º perhaps, with the west titled up.

Interesting scenario. This rendering gives the desired 28 degree solar elevation if Philae is tilted by about 18 degrees. The NW (solar panel #1) is tilted down to help keep the sun lower. The cliffs look rather more precarious here. Green dots from lower to upper are solar panels #1, #2, #6.

Click to view attachment
Full Size: http://laps.noaa.gov/albers/allsky/philae/...osite_1130b.png
4th rock from the sun
Yes, that looks natural to me. Light, shadows reflections all look consistent. smile.gif
scalbers
Indeed this is consistent with much of the information we have. I wonder though if we can/will find places (seen from Rosetta) where cliffs like this will have areas with a local slope exceeding 90 degrees?
Gerald
I've been pondering, whether it could be between boulders.
scalbers
One tricky thing here is that there's a lot of apparently clear (sky) space showing up below the horizontal in the NW and N directions. Earlier Phil (as distinct from Philae), suggested maybe the black areas are dark cliff walls. Is this indeed the case?
4th rock from the sun
QUOTE (scalbers @ Nov 30 2014, 11:59 PM) *
One tricky thing here is that there's a lot of apparently clear (sky) space showing up below the horizontal in the NW and N directions. Earlier Phil (as distinct from Philae), suggested maybe the black areas are dark cliff walls. Is this indeed the case?


You can have clear sky below the horizon if we are up from the surface. On a small world with lots of vertical relief that's possible.

But I think that you can try to tilt the panorama the opposite way, with the NW raised regarding the horizon. To match the sun position you may also need to rotate it horizontally to the left / W , but not by much.
It will still fit the data we have and the light / shadows well. At the same time, the local slopes will be lower.
Something like this (disregard the horizontal positioning):
Click to view attachment

At least it's an alternate possibility that doesn't require extreme slopes.
jmknapp
Shortly after the landing the word in press reports was that Philae had bounced "1 km" high between the 1st and 2nd touchdowns. There was a story yesterday about speculation that it was lucky the harpoons had not fired because if they had fired but had not anchored the reaction might have propelled Philae to escape velocity, given the failure of the active thrust system (although that was known to be non-operational in advance). Some of those articles also mentioned the 1 km figure. But observations and simulations appear to show a much lower and sideways bounce, even clipping the ground halfway through. I wonder where the 1 km figure came from.
Brian Lynch
QUOTE (jmknapp @ Dec 1 2014, 04:36 AM) *
...Some of those articles also mentioned the 1 km figure. But observations and simulations appear to show a much lower and sideways bounce, even clipping the ground halfway through. I wonder where the 1 km figure came from.


I saw this 1 km number all over the place too. It looks like many people are misinterpreting the landing images (especially in the ESA blog comments), mostly when it comes to using successive pixel coordinates in the landing mosaic to compute the horizontal speed -- when in fact you really have to account Rosetta's position and orientation when imaging (as in Malmer's analyses).

This is emphasized in the attached figure, where all the plots are in a rotating frame and you can see the yellow line is the ground-track of Philae while the red lines point to the locations where the lander is projected onto the image from Rosetta's perspective. It looks as if Philae is on a mostly west-to-east trajectory when in fact it is coming from the east and curling down to a southerly trajectory at the last minute.
Brian Lynch
QUOTE (jmknapp @ Dec 1 2014, 04:36 AM) *
...speculation that it was lucky the harpoons had not fired because if they had fired but had not anchored the reaction might have propelled Philae to escape velocity...


Given the information ESA has released about the landing, the harpoons should not have had the momentum to cause Philae to escape. The projectiles are about 100 g each and fire at 90 m/s. If we assume they both fire directly downwards and the entire momentum is depleted by hitting the surface, then you increase Philae's speed by 0.18 m/s upwards. Escape velocity is about 0.75 m/s at the landing site, and the speed after touchdown is supposed to be 0.381 m/s. Note that this is assuming a two-body problem when in fact the irregular gravity of 67P-C/G would have an effect (although my simulations suggest the local gravity is stronger than what would be expected from a point mass, making escape velocity even higher).

Of course if we are considering this from a mission planning perspective where we don't know what kind of elasticity will be seen during the touchdown, then it could have been the case that Philae came in at 1 m/s, bounced at 0.6 m/s, then fired the harpoons unsuccessfully and achieved escape velocity. Definitely something to ponder when designing the next comet landing spacecraft...
Gerald
QUOTE (Brian Lynch @ Dec 1 2014, 12:05 PM) *
Escape velocity is about 0.75 m/s at the landing site...

... means a circular (or in the asymmetric rotating field of gravity of the comet a much more complex) orbit at about 0.53 m/s, just 0.15 m/s faster than 0.38 m/s.
The complex orbit might contain slingshots to eventually make the lander escape.

Edit: If the 0.75 m/s actually contain the subtracted 0.28 m/s surface velocity at 2 km from the rotation axis (2 pi x 2 km / 12.4 h = 1.013 km/h = 0.28 m/s), it's even worse, since the actual escape velocity (in an intertial frame) would be 0.75 m/s + 0.28 m/s = 1.03 m/s, hence sqrt(0.5) x 1.03 m/s = 0.73 m/s for the circular orbit. Now subtract the surface velocity of 0.28 m/s, and we are at 0.45 m/s for the circular orbit relative to the surface velocity, a mere 0.07 m/s faster than 0.38 m/s.
Then all depends on the pointing of the velocity vector, the range where probabilities begin.
djellison
QUOTE (jmknapp @ Dec 1 2014, 01:36 AM) *
I wonder where the 1 km figure came from.


The Philae ProjMan during the press conf the morning after landing. The words he used were to the effective of "We bounced, maybe as much as a kilometer"

eliBonora
Hi to all,
another image processor and space enthusiast is now with you smile.gif
You write a lot, so I'll do my best to follow.

@jmknapp
CNES website, a couple of days after landing, also reported:
"D'après les premières analyses des données de CONSERT, Philae se trouverait sur le bord de la grande dépression située près du site J (Agilkia), c'est-à-dire sur le site B. Le 1er rebond l'aurait emporté à 1 km d'altitude et à près de 1 km du site visé."

ie, with Google translate:
"According to initial analyzes of CONSERT data Philae would be on the edge of the depression near the site J (Agilkia), that is to say on the site B. The first rebound would have won in 1 km above sea level and about 1 km from the target site."
Paolo
the French magazine Air et Cosmos last week reported: "to an estimated 455 m of altitude". dunno their source.
they also report 3 m of altitude for the second bounce.
Brian Lynch
QUOTE (Gerald @ Dec 1 2014, 08:21 AM) *
... means a circular (or in the asymmetric rotating field of gravity of the comet a much more complex) orbit at about 0.53 m/s, just 0.15 m/s faster than 0.38 m/s.
The complex orbit might contain slingshots to eventually make the lander escape.

Edit: If the 0.75 m/s actually contain the subtracted 0.28 m/s surface velocity at 2 km from the rotation axis (2 pi x 2 km / 12.4 h = 1.013 km/h = 0.28 m/s), it's even worse, since the actual escape velocity (in an intertial frame) would be 0.75 m/s + 0.28 m/s = 1.03 m/s, hence sqrt(0.5) x 1.03 m/s = 0.73 m/s for the circular orbit. Now subtract the surface velocity of 0.28 m/s, and we are at 0.45 m/s for the circular orbit relative to the surface velocity, a mere 0.07 m/s faster than 0.38 m/s.
Then all depends on the pointing of the velocity vector, the range where probabilities begin.


True that "escape" could just be bouncing into orbit, and with the irregular shape this could be possible (it is not typically possible since your orbit will loop back to collide inside the central body, but who knows with the comet shape, gravity, and spin).

I'm computing the escape velocity based on mu = 667 m^3/s^2, and at a radius of 2.5 km -- including velocity due to the comet rotation is not really appropriate since orbits are defined in an inertial frame (ie. the escape velocity is always in the inertial frame). You can't simply add to the escape velocity and then recompute the orbit velocity.
This is a "lo-fi" version of our main content. To view the full version with more information, formatting and images, please click here.
Invision Power Board © 2001-2024 Invision Power Services, Inc.