A possible process of producing straight valleys on Ceres....
Ceres' oblateness and density have been interpreted as evidence of an icy envelope around a rocky core. What then would have happened to the relatively brittle crust above the plastic/fluid mantle as Ceres transformed into an ellipsoid? Longitudinal cracks should have formed (I think) as tensional forces stretched the equator:
Click to view attachment
Grabens may have formed as some blocks were displaced:
Click to view attachment
(Dimensions and extent of features are not necessarily to scale.)
In recent imagery, there seem to be some longitudinal valleys (grabens?) in a few places, but they are pretty degraded. It would be interesting to see if there is (more) evidence of a fracture pattern as Dawn moves in for a closer look.
Of course this process may be completely wrong; I'm just trying to make sense of what we've seen so far.
Full Version: Dawn approaches Ceres
Tomorrow 6/3 Dawn will start 'officially' to orbit Ceres.
Max Planck institute have a nice summary of what lies ahead.
It can be noted that when they talk about the white features, they say the reflectivity is over 40% of the infalling light and that both ice and salts is a possible explanation. The latter mentioned since the possibility of salts have been mentioned in this thread.
QUOTE (Gerald @ Mar 4 2015, 10:20 PM) 
Great first step in analysing the light curves!
Slope of the light curves may be correlated to albedo. To separate slope and albedo of the terrain properly, I guess two or three parameters of the light curve need to be inferred. I can't yet predict how successful this will be, but I'm intending to work on it the next days.
Nice to see others working on the analysis, too!
I am impressed with the registration of the images in the animation. good work!
You can use the light curve to estimate the X component of the surface normal direction. (A good brdf model would help here) But you have no per pixel info on the Y component so getting an albedo value is not fully constrained. But if you assume that the local albedo between local pixel lines is constant you can estimate the Y component of the normal vector. From there it is possible to get a resonable good estimate of albedo.
Fun stuff.
I can estimate the albedo as the maximum value of the light curve. Doing this, I find a correlation of -.92 with the slopes of the light curves (over frames 17-28, as before). Looking at it as r^2, we might estimate that 85% of the variance in the slopes of the light curve is explained by the albedo. This is of course rather simplistic -- many things are not accounted for.
The currently available key dates (more or less) from now until December this year:
6 March: Dawn's orbital capture by Ceres (61,000 km)
10 April: OpNav 6 (21,000 km, 306 pixels)
14 April: OpNav 7 (14,000 km, 453 pixels)
23 April: Dawn reaches RC3 orbit (13,500 km)
May: Dawn reaches survey orbit (4,400 km)
July: Dawn reaches high-altitude mapping orbit, HAMO (1,470 km)
December: Dawn reaches low-altitude mapping orbit, LAMO (375 km)
(from here and the usual table)
So Dawn's mapping orbit starts the same month that New Horizon's Pluto flyby occurs.
QUOTE (Malmer @ Mar 5 2015, 03:05 PM)
I am impressed with the registration of the images in the animation. good work!
You can use the light curve to estimate the X component of the surface normal direction. (A good brdf model would help here) But you have no per pixel info on the Y component so getting an albedo value is not fully constrained. But if you assume that the local albedo between local pixel lines is constant you can estimate the Y component of the normal vector. From there it is possible to get a resonable good estimate of albedo.
Fun stuff.
Thanks!
I'm thinking at inferring the topography from the X component allone plus some stereo correlation, if necessary. That way (I hope) it's possible to retrieve the y slope without additional assumptions about albedo, since albedo is one information I'm hoping to be able to infer.
Fortunately Ceres isn't quite as irregular as 67P/C-G such that it's possible to add constraints about the overall shape, e.g. there shouldn't be global jumps between the ellipses of constant latitude.
I've already done some investigation about the brdf model with OpNav3, but got values not really compatible with Phong models of a smooth surface. I think, there are ways to find a solution without a-priori knowledge of the brdf, but just assuming the mere existence of a pointwise brdf with some general additional properties like one local maximum and negative second derivative along x.
After comparing the DLR version of the RC2 map with my version I see a global summed longitude error in my map of about 17 degrees (hence two images less lacking than I first calculated).
So some of my assumptions about the image geometry or the shape of Ceres may be inaccurate (I guess my 920 km pole to pole diameter assumption). With the reference map I'm very confident to be able to pin this down. The result should be an even better registration, hence better light curve data.
QUOTE (Gladstoner @ Mar 4 2015, 03:46 PM)
Ceres' oblateness and density have been interpreted as evidence of an icy envelope around a rocky core. What then would have happened to the relatively brittle crust above the plastic/fluid mantle as Ceres transformed into an ellipsoid?
This assumes that Ceres started out a sphere with the same spin rate it has now, or that it spun up for some reason. But there's no reason to assume either of those things.
Icy moons of giant planets are thought to have experienced forces like this because they would have started out spinning relatively fast (like Ceres does now), and then spun down as a result of tidal forces until they reached their present-day rotation rates, becoming more spherical in the process -- it causes global compression at the equator and extension near the poles. But there are no tidal forces on Ceres so you wouldn't get tectonics related to despinning.
Now one thing that can cause global tectonics on a body that lacks moons or a planet is global reorientation. If you have a body like Ceres (or Mars!) that experiences a big impact or major volcanic event that causes a major shift in the center of gravity, the spin axis may reorient to a more stable position, putting excess mass at the equator. That may have happened to center the Tharsis province across the equator at Mars. The preexisting rotational bulge would then be in the wrong position, and spin-related stresses would act to reshape the planet to match the new location of the spin axis.
QUOTE (elakdawalla @ Mar 5 2015, 04:23 PM)
or that it spun up for some reason.
Presumably it would have spun up somewhat as gravitational differentiation of the interior progressed. (But maybe that happened too early to be related to these surface features?)
QUOTE (ngunn @ Mar 5 2015, 11:22 AM)
Presumably it would have spun up somewhat as gravitational differentiation of the interior progressed. (But maybe that happened too early to be related to these surface features?)
That's kind of what I was visualizing (edit: progression of the differentiation, that is).
QUOTE (Habukaz @ Mar 4 2015, 05:02 PM)
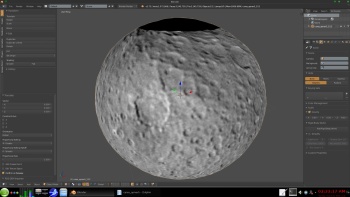
Those 'twin craters' that were very visible in the first OpNav sessions still look pretty intriguing.... Something is going on there (or rather: has gone on).
I'm assuming this refers to the two prominent depressions visible south and east of the bright spot, as in the lower portion of this image:
Click to view attachment
It seems like this region was omitted from both the most recent image/movie releases. Would any of Dawn the team members care to comment on whether this was intentional? Perhaps something they'd like to interpret and publish/publicize prior to a more general release? That's not an unreasonable prerogative, I'd just like to clarify where we stand.
QUOTE (elakdawalla @ Mar 5 2015, 10:23 AM)
This assumes that Ceres started out a sphere with the same spin rate it has now, or that it spun up for some reason. But there's no reason to assume either of those things.
I was going with the assumption that the oblateness was due to the differentiation of water within Ceres. Otherwise, the hypothesis of a subsurface ocean or icy mantle would seem unwarranted. The other evidence of water ice -- low density and mineralogy possibly related to water -- could be explained by an undifferentiated rock/ice mixture. I thought the relatively high rotation rate of Ceres would have caused the less viscous envelope to flex out more and more as it grew in mass. I figured the rotation rate could have varied due to this (perhaps even slowed a bit), but wasn't a primary driver of any form change. Again, I'm sure I'm missing a detail or ten here, but then that's related to why Dawn was sent to Ceres in the first place.
(Edit: rock/ice mixture, not water/ice mixture)
There may not be major planetary tidal forces at play here, but small tidal effects from the Sun and possibly from Jupiter are surely present. If, as suspected, a global ocean of many kilometres depth was present, the different results of tidal forces acting on rock, liquid and icy mantle and the resulting friction has one would think affected spin rates in the past. The progressive freezing of the ocean from the poles down and the resulting changes in mass distribution, could have shifted the axis of rotation. Large resurfacing events would have changed the phase of considerable volumes of material also creating an unbalancing effect. It may be the stretching/contraction events happened only during a certain period of Ceres's evolution, most probably when the icy mantle was a lot thinner, and much of the evidence is hidden by later geology and the cumulative effects of the slow sublimation of volatiles from the surface layers. Another possibility is gas evolved from the contracting rocky core and ocean are trapped beneath the ice creating pressure that deforms the surface and maybe eventually cracks the ice layer.
Lots of guesses and assumptions, but 4.5 Billion years is an awful long time for a body with Ceres's apparently multiphase composition to go through a variety of physical and geological changes as the ratios of the phases slowly change. Just a few ideas to cogitate upon while we wait for more pictures.
Lots of guesses and assumptions, but 4.5 Billion years is an awful long time for a body with Ceres's apparently multiphase composition to go through a variety of physical and geological changes as the ratios of the phases slowly change. Just a few ideas to cogitate upon while we wait for more pictures.
I'm sure that one of the key questions for Dawn is does Ceres have an ocean or did it have one in the past? If either is true, it would generate a lot of interest.
What a coincidence!
QUOTE (Habukaz @ Mar 5 2015, 09:53 AM)
The currently available key dates (more or less) from now until December this year:
6 March: Dawn's orbital capture by Ceres (61,000 km)
10 April: OpNav 6 (21,000 km, 306 pixels)
14 April: OpNav 7 (14,000 km, 453 pixels)
23 April: Dawn reaches RC3 orbit (13,500 km)
May: Dawn reaches survey orbit (4,400 km)
July: Dawn reaches high-altitude mapping orbit, HAMO (1,470 km)
December: Dawn reaches low-altitude mapping orbit, LAMO (375 km)
(from here and the usual table)
So Dawn's mapping orbit starts the same month that New Horizon's Pluto flyby occurs.
6 March: Dawn's orbital capture by Ceres (61,000 km)
10 April: OpNav 6 (21,000 km, 306 pixels)
14 April: OpNav 7 (14,000 km, 453 pixels)
23 April: Dawn reaches RC3 orbit (13,500 km)
May: Dawn reaches survey orbit (4,400 km)
July: Dawn reaches high-altitude mapping orbit, HAMO (1,470 km)
December: Dawn reaches low-altitude mapping orbit, LAMO (375 km)
(from here and the usual table)
So Dawn's mapping orbit starts the same month that New Horizon's Pluto flyby occurs.
What a coincidence!
QUOTE (Phil Stooke @ Mar 4 2015, 02:00 AM)
Nice demonstration of the fact that my explanation can't be correct!
Phil
Phil
Adjusted light curve maps to DLR map of RC2, of this MPS article, still based on the 27 frames of pia18920.gif:

I've assumed a sphere projected to a circle with
Assumed rotation 9.85 degrees per pia18920.gif frame.
Hence, Phil, your first explanation looks rather correct. Sorry for needing that long to clarify this.
This doesn't necessarily mean, that the assumptions are the best possible; it's just the inferred assumptions underlying pia18920.gif, and the map by RC2 on the MPS site. You'll note the pretty good match of the animated light curve maps with the MPS RC2 map.
With the confirmation of Dawn's capture into orbit around Ceres, a couple of OpNav 5 frames were released: http://photojournal.jpl.nasa.gov/keywords/dp
They are somewhat fuzzy around the sunlit edge, I guess that is an artefact...?
They are somewhat fuzzy around the sunlit edge, I guess that is an artefact...?
Since Dawn's now in orbit, I made a new thread. Keep discussion of images taken through the Op Nav 5 crescents in here; move on to the next thread for the first orbit and RC3.
This is a non-enhanced zoom (800%) of the bright spot near the terminator in the second newly released image (PIA19312). Sure seems like this is at the top of local elevation to me. Very bright compared to the surroundings. I wonder if this bright spot is also saturating the detector?
Click to view attachment
Andy
Click to view attachment
Andy
A first attempt to retrieve slope data in longitude direction from pia18920.gif (using light curve maps posted above), certainly crowded with processing artifacts, mainly due to inaccurate registering:
Click to view attachment
Since the maximum brightness is mostly in the first two usable light curve frames, I've used the deltas to infere the phase shift, interpreted as raw slope information.
Click to view attachment
Since the maximum brightness is mostly in the first two usable light curve frames, I've used the deltas to infere the phase shift, interpreted as raw slope information.
QUOTE (Gerald @ Mar 6 2015, 01:16 PM)
A first attempt to retrieve slope data in longitude direction ....
My initial take on the light curves was that they provided an indication of surface roughness, which is what I aimed to extract by looking at the slopes of the light curves. After further thought, if the peak of the curve differs from the midpoint, I can see whereas this would provide an indication of E-W slope. Is E-W slope what you mean by slope in the longitude direction? The only way I can envisage to get a sense of slope in the N-S direction is to assume common global albedo, and infer slope from the maximum intensity of each pixel (effectively, shape from shading).
EDIT: I've taken a closer look at the light curves. I had presumed that they would be roughly bell-shaped, peaking at the center. I see that they are actually linear, generally declining from a peak with increasing frame number (some wrap around back through early frames). From this, I gather that they are absolute values centered on the peak. Not what I'd expected, but I can kind of see where they came from. Anyway, based upon my revised perspective, I have revised/expanded my plot of light curve slopes to take fuller advantage of the data. As I interpret this, greener is smoother, redder is rougher.
Click to view attachment
QUOTE (algorimancer @ Mar 5 2015, 07:26 PM)
I'm assuming this refers to the two prominent depressions visible south and east of the bright spot, as in the lower portion of this image:
It seems like this region was omitted from both the most recent image/movie releases. Would any of Dawn the team members care to comment on whether this was intentional? Perhaps something they'd like to interpret and publish/publicize prior to a more general release? That's not an unreasonable prerogative, I'd just like to clarify where we stand.
It seems like this region was omitted from both the most recent image/movie releases. Would any of Dawn the team members care to comment on whether this was intentional? Perhaps something they'd like to interpret and publish/publicize prior to a more general release? That's not an unreasonable prerogative, I'd just like to clarify where we stand.
Those are the ones, yes. I doubt that the RC2 images not included reveal terribly much about the one to the east; they've published some of the best views of the one to the west, and it's still a mystery. I'd guess it's fairly random that some of the images have not been published yet.
Looking more closely at the feature to the west, I noticed more details that others might have noticed too (probably don't show on monitors with poor contrast):


yet more linear/curved features. They look like lower terrain (like e.g. valleys): you can see how they fill up with shadows as the sun sets, and their shapes are almost completely unchanged from one frame to the next (!), supporting the idea that they are real topographic features. They appear to go almost all the way in to the brighter centre (central peak?) of the feature.
QUOTE (Habukaz @ Mar 6 2015, 02:49 PM)
...yet more linear/curved features...
The term "scalloping" comes to mind. Perhaps a product of differential sublimation associated with topographically controlled illumination? Seems like we've seen something similar at one or more Saturnian satellites.
Not sure which Saturnian moons and which features are being referred to.
While looking some more at those cropped images, I noticed what looks like a shadow east of the central area of the 'crater': a small area that is darker grey in the first frame and considerably darker in the second. In the third, it appears to have grown in size. It is very small, but given how it seems to change in a similar way as one would expect a shadow to change as night nears, it's tempting to guess that it actually is a shadow and is caused by some sort of central peak.

As the 'crater' enters the nightside (picture above), it does indeed also look like the central portion remains lit for a longer period of time than the rest of the interior.
While looking some more at those cropped images, I noticed what looks like a shadow east of the central area of the 'crater': a small area that is darker grey in the first frame and considerably darker in the second. In the third, it appears to have grown in size. It is very small, but given how it seems to change in a similar way as one would expect a shadow to change as night nears, it's tempting to guess that it actually is a shadow and is caused by some sort of central peak.
As the 'crater' enters the nightside (picture above), it does indeed also look like the central portion remains lit for a longer period of time than the rest of the interior.
QUOTE (algorimancer @ Mar 6 2015, 09:36 PM)
Is E-W slope what you mean by slope in the longitude direction?
Yes.
QUOTE (algorimancer @ Mar 6 2015, 09:36 PM)
The only way I can envisage to get a sense of slope in the N-S direction is to assume common global albedo, and infer slope from the maximum intensity of each pixel (effectively, shape from shading).
I like those challenges, which look insoluble at first glance.
Recent images at 200%:
PIA19311:
Click to view attachment
PIA19312:
Click to view attachment
To prevent altering the pixels during the size increase, I magnified each TIF image in an image editor (instead of increasing the image size), did a screen capture, and then saved it as a separate JPG file at maximum quality.
PIA19311:
Click to view attachment
PIA19312:
Click to view attachment
To prevent altering the pixels during the size increase, I magnified each TIF image in an image editor (instead of increasing the image size), did a screen capture, and then saved it as a separate JPG file at maximum quality.
One thing these crescent views show is how flat bottomed the craters are outside the polar regions, as well as how smooth some areas are in the equatorial region. The steeper elevation changes towards the South Pole seem to "sparkle". Certain phase angles seem to pick out a more reflective component in the surface composition. Is this due to the grain size of the regolith, its chemical composition, or even water ice just below the surface? The reflectance spectra will hopefully give us the answer.
It appears the released crescent images were vertically inverted. Here they are right side up:
Click to view attachment
Click to view attachment
Click to view attachment
Click to view attachment
PIA19310b_lg at 200% with unaltered pixels:
Click to view attachment
Click to view attachment
At 2x, it is easier for my eyes, at least, to make out maximum detail.
Click to view attachment
Click to view attachment
At 2x, it is easier for my eyes, at least, to make out maximum detail.
This thread can be closed in favour of thread about Ceres orbiting: http://www.unmannedspaceflight.com/index.p...mp;#entry218672
This would improve forum readibility.
ADMIN NOTE: Determining when threads are closed or new topics started throughout an ongoing mission is decided by the Forum's administration/moderation team members. Closing a thread generally only happens if a discussion becomes a serious problem to moderate or the topic is outside of the Forum's scope. We generally don't close a topic because a certain phase of the mission has come to an end. This is because new information can come to hand or updated image data is released via the PDS or similar system, that can be used to update a topic at a later point.
Please note that if members have a suggestion about changes to a topic, then they can make them directly to an admin/mod at any time via the direct message system, rather than adding 'noise' to the actual discussion which reduces its readability.
PDS has a shape file
ftp://naif.jpl.nasa.gov/pub/naif/DAWN/misc/ceres/
hipass of the baked dem ( 0 to 360 mapping)
ftp://naif.jpl.nasa.gov/pub/naif/DAWN/misc/ceres/
hipass of the baked dem ( 0 to 360 mapping)
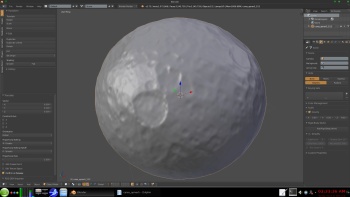
For anyone comfortable with R, here is some R code to read and view the shape files -- it will open a window with an interactive 3D viewer of the shape data, allowing you to use the mouse and mouse wheel to rotate or zoom the data. For context, I have it also plotting the X, Y, and Z axes in red, green, and blue (respectively); blue should be the North-South axis.
To use it, you'll need to have R installed (or RStudio, which is my preference). Once R is installed, install the rgl package.
Extract the downloaded shape files within a directory of your choice, then you can use the following code to view the shape file in R:
#BEGIN R CODE...
#Run this line once. Specify the directory where the shape files (such as "ceres_opnav5_128.txt") are stored
setwd("C:\\Downloads\\Ceres3D")
#Run the next block once (imports the rgl library, defines functions)
#BEGIN...
library(rgl)
#Given filename, reads shape file
#Returns list containing N=#vertices, M=#plates, vertices as N-row X 3-col matrix
# (1 vertex per row, each vertex being an x,y,z coordinate),
# plates as M-row X 3-col matrix (each row being a vector containing the 3 vertex integer indices
# defining the corners of a triangular plate, listed by convention in CCW order)
ReadShapeFile<-function(filename)
{
N=scan(filename,n=1,what=integer())
vertsM=matrix(scan(filename,n=4*N,skip=1),byrow=TRUE,nrow=N,ncol=4)[,-1]
M=scan(filename,n=1,what=integer(),skip=1+N)
platesM=matrix(scan(filename,n=4*M,what=integer(),skip=1+N+1),byrow=TRUE,nrow=M,
ncol=4)[,-1]
list(N,M,vertsM,platesM)
}
MyView3D<-function()
{
sFileName=file.choose()
shape=ReadShapeFile(sFileName)
open3d()
par3d(windowRect=c(100, 100, 600, 600))
rgl.pop(type="lights")
rgl.light(theta=-60,phi=0,ambient="#010101",specular="#000000",diffuse="#CFCFCF")
bg3d("slategray")
material3d(col = "black")
rgl.triangles(shape[[3]][as.vector(t(shape[[4]])),],col="grey")
rgl.lines(c(-510,510),c(0,0),c(0,0),col="red")
rgl.lines(c(0,0),c(-510,510),c(0,0),col="green")
rgl.lines(c(0,0),c(0,0),c(-510,510),col="blue")
}
#....END
#Run the next line each time you want to view a 3D shape file
MyView3D()
#To save a snapshot of the current view, set the filename and run the following line
FileTitle="ThisFileName"
rgl.snapshot(file=paste(paste(FileTitle,".png"),sep=""))
#...END R CODE
And here's an example of what you'll see when you get it working:
Click to view attachment
You can also resize or maximize the window (it defaults to a smallish size).
These shape files may strain your system -- I'm using a 64-bit computer with 32G of ram, and having no difficulties. Your mileage may vary.
A nice new thing at LPSC - a map of Ceres in false colour using the RC1 images - yes, that was multispectral. There's a lot of variation across longitudes. Nothing released officially yet, of course. This was on a poster.
Phil
Phil
From the 46th Lunar and Planetary Science Conference :
http://www.hou.usra.edu/meetings/lpsc2015/pdf/sess630.pdf
http://www.hou.usra.edu/meetings/lpsc2015/pdf/sess630.pdf

Some interesting yet confusing tweets from the LPSC:
https://twitter.com/Laurent_Montesi/status/...830420697387008
https://twitter.com/MonicaGrady/status/577830943995621376
Is this based on RC2 observations, or OpNav 4-5? I got the impression from the press conference where the RC2 rotation animation was presented that cryovolcanism was low on the list for possible explanations for the brightest spots - and now it suddenly ranks high again?
QUOTE
#LPSC2015 #Ceres Bright spot in center of basin, seen even above rim, so believe it's outgassing (needs higher res to get spectral info)
https://twitter.com/Laurent_Montesi/status/...830420697387008
QUOTE
Icy plume possibly seen on limb of Ceres. Exciting! #LPSC2015
https://twitter.com/MonicaGrady/status/577830943995621376
Is this based on RC2 observations, or OpNav 4-5? I got the impression from the press conference where the RC2 rotation animation was presented that cryovolcanism was low on the list for possible explanations for the brightest spots - and now it suddenly ranks high again?
QUOTE (Habukaz @ Mar 17 2015, 09:38 AM)
Some interesting yet confusing tweets from the LPSC:
Wow. This holds up, it's game-changing for planetary exploration.
QUOTE (Habukaz @ Mar 17 2015, 03:38 PM)
Some interesting yet confusing tweets from the LPSC:
Is this based on RC2 observations, or OpNav 4-5? I got the impression from the press conference where the RC2 rotation animation was presented that cryovolcanism was low on the list for possible explanations for the brightest spots - and now it suddenly ranks high again?
Is this based on RC2 observations, or OpNav 4-5? I got the impression from the press conference where the RC2 rotation animation was presented that cryovolcanism was low on the list for possible explanations for the brightest spots - and now it suddenly ranks high again?
I think this reflect different ideas and opinions among different people. There might even be one or two who is like me - though I am certainly not a planetary scientist - who look into a problem from several different perspectives in a single month.
The first tweet go a reply with the alternative explanation that: "'''its a granite compounded with ice , a remnant of impact object of the crater."
My best guess is that the idea is based on that image used in the rotation where the bright spot stayed very bright even on the terminator.
So what we're seeing in those tweets is an ongoing debate on how to interpret what we've seen at moderate resolution.
QUOTE (Habukaz @ Mar 17 2015, 06:38 AM)
Some interesting yet confusing tweets from the LPSC:
https://twitter.com/Laurent_Montesi/status/...830420697387008
https://twitter.com/MonicaGrady/status/577830943995621376
Is this based on RC2 observations, or OpNav 4-5? I got the impression from the press conference where the RC2 rotation animation was presented that cryovolcanism was low on the list for possible explanations for the brightest spots - and now it suddenly ranks high again?
I wonder what they are referring to - it's quite a couple tweets!
I took look at the white spot picts again to see any possible plume pixels and the only thing I can see is these 5 pixels (yellow circle in inset image). However if you align it to the previous frame in the rotation movie (the main image), I think they correspond to the high point of the crater rim (yellow arrow). Note, I have cranked up the exposure to max to bring out the dim pixels.
Click to view attachment
Monica Grady refers to a feature seen on the limb rather than the terminator so maybe those aren't the right images to look in??
QUOTE (ngunn @ Mar 17 2015, 01:40 PM)
Monica Grady refers to a feature seen on the limb rather than the terminator so maybe those aren't the right images to look in??
That could explain why a few frames -- including one or two with the bright spot on the limb -- were left out of the released rotation sequence.
A bit more detail on what was presented at LPSC regarding white spots...
Bright spots on Ceres could be active ice
http://www.nature.com/news/bright-spots-on...=TWT_NatureNews
The pictures reveal the spots even when they are near the edge of Ceres, when the sides of the impact crater
would normally block the view of anything confined to the bottom. The fact that something is visible at all
suggests that the feature must rise relatively high above the surface.
"What is amazing is that you can see the feature while the rim is still in the line of sight, said Andreas Nathues,
a planetary scientist at the Max Planck Institute for Solar System Research in Göttingen, Germany."
Craig
Some images grouped and annotated:

My processing of the bright-spot area of the DEM:
http://lc84.altervista.org/vba4.stl
It's just a quick-and-dirt 3d model, a bit more (just a bit) than a point-cloud; I'm working to get a surface instead, but what's very interesting is the altitude of the center of the crater: although I can't know the actual values of altitudes corresponding to grey levels, the relative altitudes are correct:
QUOTE (mcgyver @ Mar 18 2015, 09:25 AM)
Some images grouped and annotated:
My processing of the bright-spot area of the DEM:
It's just a quick-and-dirt 3d model, a bit more (just a bit) than a point-cloud; I'm working to get a surface instead, but what's very interesting is the altitude of the center of the crater: although I can't know the actual values of altitudes corresponding to grey levels, the relative altitudes are correct
What an IMPRESSIVE work mcgyver : thanks a lot for sharing this with us !

QUOTE (mcgyver @ Mar 18 2015, 12:25 AM)
My processing of the bright-spot area of the DEM:
http://lc84.altervista.org/vba4.stl
It's just a quick-and-dirt 3d model, a bit more (just a bit) than a point-cloud; I'm working to get a surface instead, but what's very interesting is the altitude of the center of the crater: although I can't know the actual values of altitudes corresponding to grey levels, the relative altitudes are correct:
Great processing, but as others have mentioned, I think the saturated pixels in the crater obfuscate any real depth cues for the DEM algorithms. I think the the picture with the most value is the one in the rotation movie right before it goes out of view, that has the central spot unsaturated.
Click to view attachment
From that picture it could be consistent with a floor with reflective ejecta spread around (the at 5-8% of the brightest pixel value). The little white spot peak is only 25% of the brightest pixel value so it's either likely a less albedo, or more likely - much smaller (3 adjacent 1/4 pixels). For the heck of it I tested the pixels in this image to try and get a better idea of what might be going on.
Click to view attachment
% conversions relative to the brightest 242 pixel are here:
12 5%
20 8%
28 12%
44 18%
53 22%
60 25%
92 38%
100 41%
124 51%
132 55%
144 60%
163 67%
179 74%
194 80%
219 90%
227 94%
235 97%
242 100%
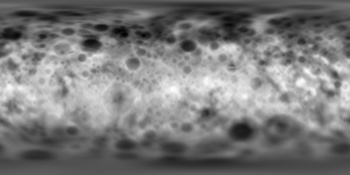
Based on the maps posted previously, here's color coded topography + hill shading:
Click to view attachment
And here's topography + visual surface features:
Click to view attachment
Very interesting surface!
Click to view attachment
And here's topography + visual surface features:
Click to view attachment
Very interesting surface!
Just found this interesting Ceres images resources:
http://dawndata.igpp.ucla.edu/tw.jsp?secti...a/CeresApproach
http://dawndata.igpp.ucla.edu/tw.jsp?secti...a/CeresApproach
QUOTE (Ken2 @ Mar 18 2015, 08:41 PM)
From that picture it could be consistent with a floor with reflective ejecta spread around (the at 5-8% of the brightest pixel value). The little white spot peak is only 25% of the brightest pixel value so it's either likely a less albedo, or more likely - much smaller (3 adjacent 1/4 pixels).
Oh yes it was a good attempt by mcgyver there. But as have been pointed out, the wiremap is based on data we can not place much confidence in.
The image you provided Ken2 is perhaps the best good example we have where the bright spot is seen at the smallest size.
Yet even there it show signs of being saturated with light bleeding into adjacent pixels.
One of the scientists involved with the Dawn mission mentioned a possible albedo of 0,4 for this feature.
At the time I accepted the number as realistic - since we then thought of ice that had been exposed by the impact and since then dusted over somewhat.
But if this feature instead is fresh, and is associated with the outgassing perhaps even a geyser like feature, it would be smaller still and the albedo might be as high as 0,8 or even 0,9! So in short, the smaller this bright area turn out to be, the more interesting it will be. =)
QUOTE (4throck @ Mar 18 2015, 06:18 PM)
Based on the maps posted previously, here's color coded topography + hill shading:
...
...
It would be informative to see something like this referenced to the geoid, if one were available.
Has anyone estimated the minimum albedo of the most prominent bright spot?
QUOTE (mcgyver @ Mar 18 2015, 03:25 AM)
Some images grouped and annotated:
Here's my own take on a height map. I estimated an ellipsoid per the DEM, then took height as the difference between the DEM and the fitted ellipsoid (the overlaid ellipsoid fits rather well overall), and the gray levels linearly span 15.4 kilometers from lowest (black) to highest (white) elevation; the scattered white pixels near the poles are missing data. Originally this was 1 pixel per degree, but resampled to 4 pixels per degree. I have the 0-longitude at the center, mainly for my own convenience.
Click to view attachment
There are some interesting structures apparent in the height map, aside from the craters. This perspective lets us focus on the region near 180 degrees longitude (centered). Note the two prominent equatorial lows outlined in red, particularly the one near 160 degrees (left of center) -- this is the opposite of evidence for viscous relaxation. In that same region, outline in green, are a region of valleys and ridges which appear more tectonically derived rather than due to impacts. Everyone's favorite white spot is circled in yellow, and an anomalous high spot is circled in blue.
Click to view attachment
I would guess that the ejecta from the sand dollar feature drapes a tectonically similar region to that on the opposite side of Ceres, only hinted at on the existing surface.
And here's the same height map, with the height mapped to colors from lowest in blue, middle in green, to highest in red. I'm not sure this adds anything dramatically more informative, but it is certainly pretty
Click to view attachment
Click to view attachment
This is a "lo-fi" version of our main content. To view the full version with more information, formatting and images, please click here.