machi
Jan 28 2016, 08:34 PM
Thanks Phil!
QUOTE (JRehling @ Jan 28 2016, 08:37 PM)

Beautiful work, Machi! It's a challenge to get the very low-res topographical data merged with the albedo map, but your result is thought-provoking. With my Titan map/globe, I skipped the topographical data to focus on the color, but the topography is definitely worthwhile as well. With better data, a map could provide all three, but low-res topography doesn't lend itself, I guess, to being demonstrated through shading.
Yes, merging elevation data with SAR/ISS map was maybe the most difficult part. Elevation data have very low resolution (1 or 2 pixels per degree) so topography shading is effectively impossible. So this isn't topographic map, it's SAR/ISS map with overlaying low-res elevation data (BTW, the same data which Ralph Lorenz used in his first ever topographic map of Titan). I also wanted to include VIMS data as in your very nice map but there isn't yet VIMS map with quality which I need.
Ian R
Jan 28 2016, 09:31 PM
Great map Daniel! I'm only browsing on a mobile device, but even so, the quality and sheer level of detail are clearly evident.
Decepticon
Feb 28 2016, 09:54 PM
Do those maps contain SAR radar data after June 7, 2012?
I have seen no Full swaths released after that date.
ngunn
Feb 28 2016, 10:31 PM
I've noticed that as well. I check Jason Perry's SAR site from time to time but the flow of new data appears to have stopped.
Ian R
Feb 29 2016, 07:14 AM
This USGS mosaic contains all radar swathes up to and including the August 2014 T-104 data return:
http://astrogeology.usgs.gov/search/detail...n180_128ppd/cubI used this mosaic and combined part of it with a cleaned and de-seamed and colorized ISS mosaic to produce this dynamic view of Adiri:
Adiri Mountainous Plateau of Titan by
Ian Regan, on Flickr
Ian R
Feb 29 2016, 07:17 AM
A list of the recent radar returns:
QUOTE
_________________________________________
T-83--- Sequence S73, May 21, 2012
http://pds-imaging.jpl.nasa.gov/data/cassi...DR_0239/EXTRAS/_________________________________________
T-84--- Sequence S73, Jun 06, 2012
http://pds-imaging.jpl.nasa.gov/data/cassi...DR_0240/EXTRAS/___________________________________________
T-86--- Seq S75, Sep 26, 2012
_________________________________________
T-91--- Seq S78, May 23, 2013
http://pds-imaging.jpl.nasa.gov/data/cassi...DR_0248/EXTRAS/_________________________________________
T-92--- Seq S79, July 10, 2013
http://pds-imaging.jpl.nasa.gov/data/cassi...er/CORADR_0250/_________________________________________
T-95--- Seq S80,Oct 13, 2013
http://pds-imaging.jpl.nasa.gov/data/cassi...DR_0253/EXTRAS/_________________________________________
T-98--- Seq S82, Feb 02, 2014 (redelivery)
http://pds-imaging.jpl.nasa.gov/data/cassi...DR_0257/EXTRAS/_________________________________________
T-104--- Seq S85,Aug 21, 2014
http://pds-imaging.jpl.nasa.gov/data/cassi...DR_0261/EXTRAS/
volcanopele
Feb 29 2016, 07:59 PM
QUOTE (ngunn @ Feb 28 2016, 03:31 PM)
I've noticed that as well. I check Jason Perry's SAR site from time to time but the flow of new data appears to have stopped.
Yeah, I haven't been keeping it up, mostly because the RADAR team now includes JPG versions of the SAR swaths in the Extras section of their PDS releases, as Ian R links to.
craigmcg
Mar 31 2016, 02:00 PM
Here's a nice summary map that just came out:
Link to page:
http://photojournal.jpl.nasa.gov/catalog/PIA20022
Juramike
Apr 1 2016, 02:43 AM
Those are images, not maps. Maps are derived products from data such as this.
Just quibbling a bit....
stevesliva
Apr 1 2016, 05:02 AM
QUOTE (Juramike @ Mar 31 2016, 10:43 PM)
Those are images, not maps. Maps are derived products from data such as this.
Just quibbling a bit....
But they're composited -- what steps that up to a map?
Phil Stooke
Apr 1 2016, 06:21 AM
"Just quibbling a bit...."
A groundless quibble, I'm afraid. This is VIMS data, collected over more than a decade - the high resolution VIMS cubes only cover small areas. So all that material has been assembled into a global mosaic (a mapping procedure if ever there was one) and is presented to us in an orthographic map projection - another mapping procedure. The small image of a crater might be 'not a map' but the global mosaic certainly is.
Phil
Juramike
Apr 2 2016, 12:31 AM
A basemap for mapping, maybe. But I wouldn't consider the VIMS dataset an interpreted or representative map product. Nor would I consider the SAR mosaic, even if normalized to a standard incidence angle, a true map product.
Just at what point does an image become a map product is a good question, and probably open to interpretation? Is an image a map already at acquisition? After calibration? Data correction? Radiometric correction (very very difficult on Titan)? Mosaic assembly? Projection? Contrast-enhancement and recolorization with a color scale? Scribbling colors and annotations on the data?
For me, mapping is the point where someone start scribbling interpretations, annotations, and representations on top of the dataset: "The rim of the crater is located here". "This is a mountain, the boundary is here." "This land is called Adiri" "Here there be tygers.", etc.
-Mike
JohnVV
Apr 2 2016, 12:59 AM
QUOTE
Just at what point does an image become a map product
it depends on the person/artist
for me it is when i can render a image from a sphere or mesh , basically a seamless texture
for others it is the annotation of locations
t_oner
Dec 26 2016, 09:05 PM
Here is a non-local denoising filter:
http://ximagic.com/d_index.html . Not as good looking as Antoine Lucas' work but better than none.
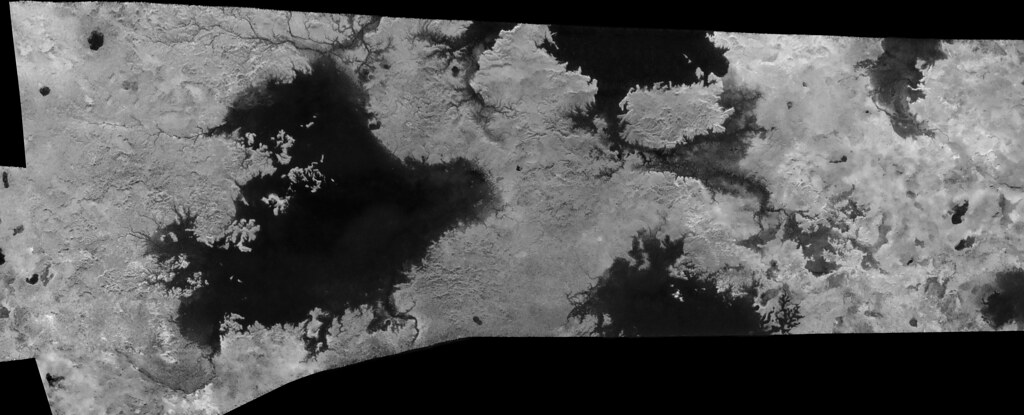
t_oner
Dec 28 2016, 09:55 AM
Part of Ligeia Mare.
Floyd
Dec 28 2016, 01:44 PM
Your link gave seven different denoising filters, which one or ones did you use?
scalbers
Dec 28 2016, 03:33 PM
Very nice view of Ligeia Mare. In the long run this could really improve the global radar maps. On the link I recall just one of the filters was the "non-local" one.
t_oner
Dec 28 2016, 04:13 PM
It is a single plugin with 7 different algorithms. Non-Local Denoising gives the best results which is the same method used by Antoine Lucas. There is also a free Java plugin for ImageJ used by medical researchers which I did not try.
http://imagej.net/Non_Local_Means_DenoiseAttached image is a crop from PIA09218, uncompressed files give a better result as expected (slightly sharpened). The success of the algorithm is measured by the difference with the original, which should be purely noise and not have any discernible features common with the original (may be except noise bands, artifacts etc.)
scalbers
Apr 1 2017, 02:40 PM
Here's a paper describing techniques for extracting more detail from ISS images.
https://arxiv.org/pdf/1103.3215.pdf
Phil Stooke
Apr 1 2017, 04:03 PM
I find this even more impressive:
http://www.hou.usra.edu/meetings/lpsc2017/eposter/2518.pdf(link to LPSC poster)
Phil
scalbers
Apr 1 2017, 05:14 PM
Thank for noting this Phil, I earlier inadvertantly posted another semi-related link. Here is what I was also looking at, the same work that you are noting:
http://www.hou.usra.edu/meetings/lpsc2017/pdf/2518.pdfIt's neat to see how the ISS images now show more detail near the Huygens landing site.
Ian R
Jun 30 2018, 05:27 PM
I'm pleased to finally be able to reveal the fruits of a project that's been a long time (~4 years) in the making: an updated, amended, and restored version of the 2013
USGS Titan Cassini Controlled ISS Global Mosaic.
Cassini ISS Titan Mosaic --- Equatorial (USGS/Ian Regan)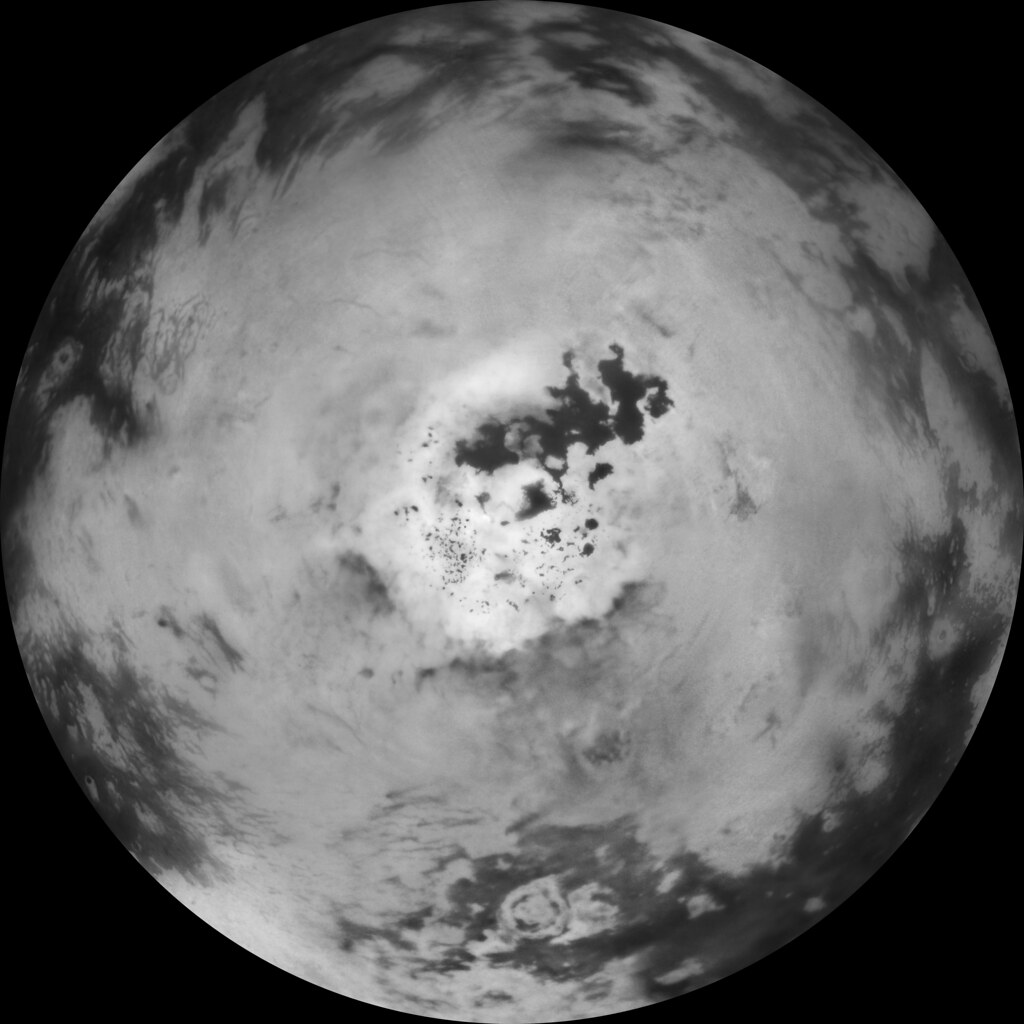
Cassini ISS Titan Mosaic --- North Polar (USGS/Ian Regan)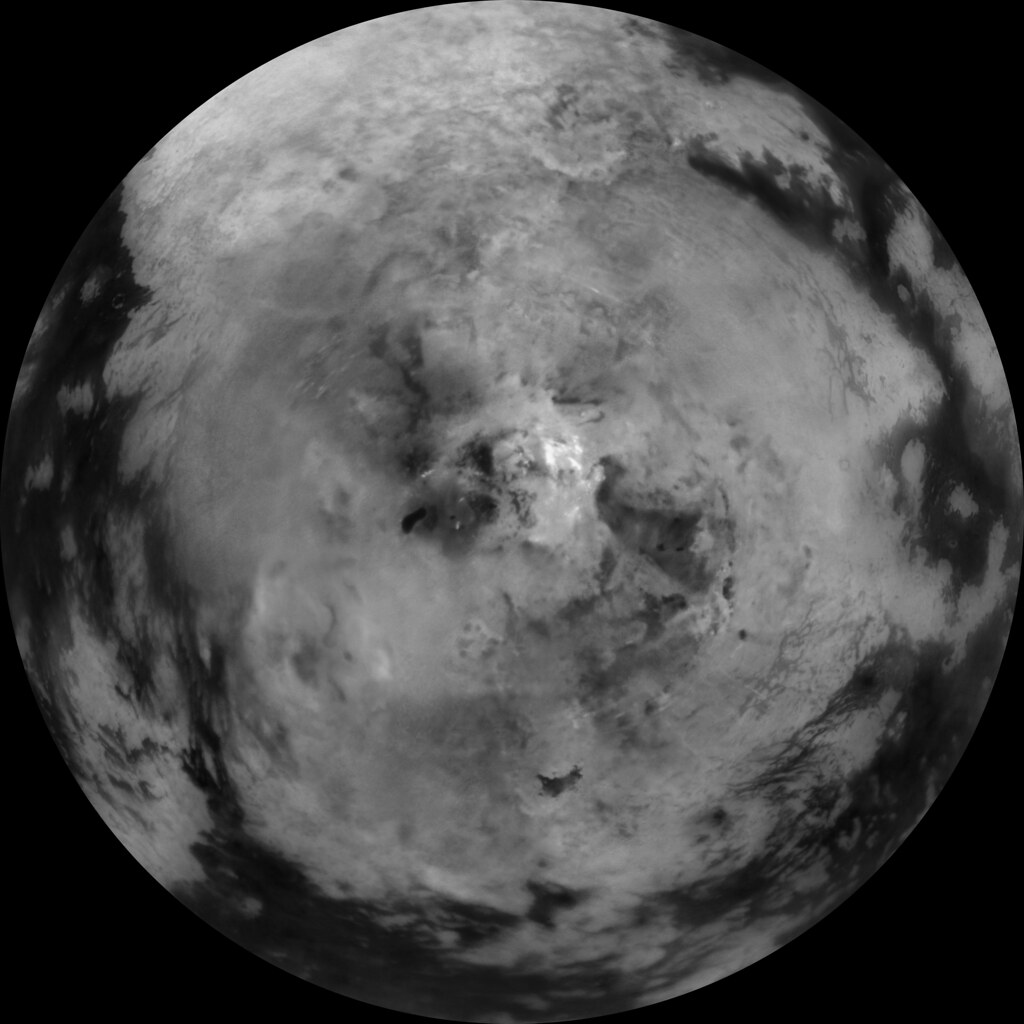
Cassini ISS Titan Mosaic --- South Polar (USGS/Ian Regan) by
Ian Regan, on Flickr
Credit: NASA/JPL/Space Science Institute/Cassini Data Analysis Program/USGS Astrogeology Science Center/Ian Regan
This restoration was done primarily for the big screen film
IN SATURN'S RINGS, by Stephen van Vuuren. For more details on the mosaic, and how I processed the polar regions completely from scratch, please visit the film's website:
https://www.insaturnsrings.com/titan-seam-blending
antipode
Jul 1 2018, 01:04 AM
Wonderful!
Just out of interest. Is that a lake, past or present, at roughly the 6 o/clock position perhaps about 60 south in the southern hemisphere polar projection?
P
Ian R
Jul 1 2018, 01:15 AM
Thanks!
In answer to your question, that dark feature is Polaznik Macula a formation that plays host to two suspected temperate lakes: Sionascaig Lacus and Urmia Lacus:
http://thedragonstales.blogspot.com/2015/0...rmia-lacus.html
ngunn
Jul 1 2018, 01:17 PM
Truly magnificent maps! A joy to let the gaze wander freely at last over this wondrous world.
PDP8E
Jul 1 2018, 07:32 PM
Ian,
Wow, those maps are fantastic! Thank you for showing us your long hard work. The explanation of how you did it, is inspiring. You are one cool cat!
Phil Stooke
Jul 3 2018, 01:46 AM
Agreed! These are beautiful.
Phil
Daniele_bianchino_Italy
Jul 6 2018, 08:48 PM
wow!

sittingduck
Jul 7 2018, 08:30 AM
Ian, these are simply wonderful. Thank you!
Ian R
Jul 7 2018, 10:48 PM
Thanks everyone for the positive responses.

As I'm sure you can imagine, this data was an absolute bear to work with, so although room for improvement undoubtedly exists, I'm generally delighted with the results.
I intend to post versions incorporating the SAR radar data (perhaps colour-coded? I'm undecided on the exact presentation.)
But for now, here are those three image products again, this time merged with topographical information from a paper by
P. Corlies et al:
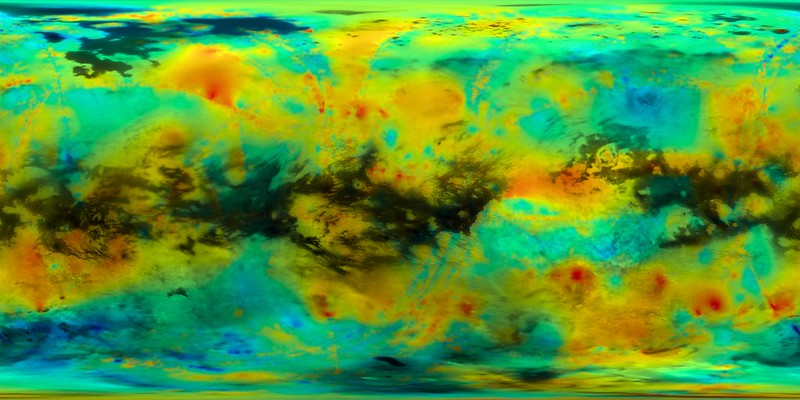 Cassini ISS Titan Mosaic & Topography: Equatorial View (USGS/Ian Regan/P.Corlies et al.)
 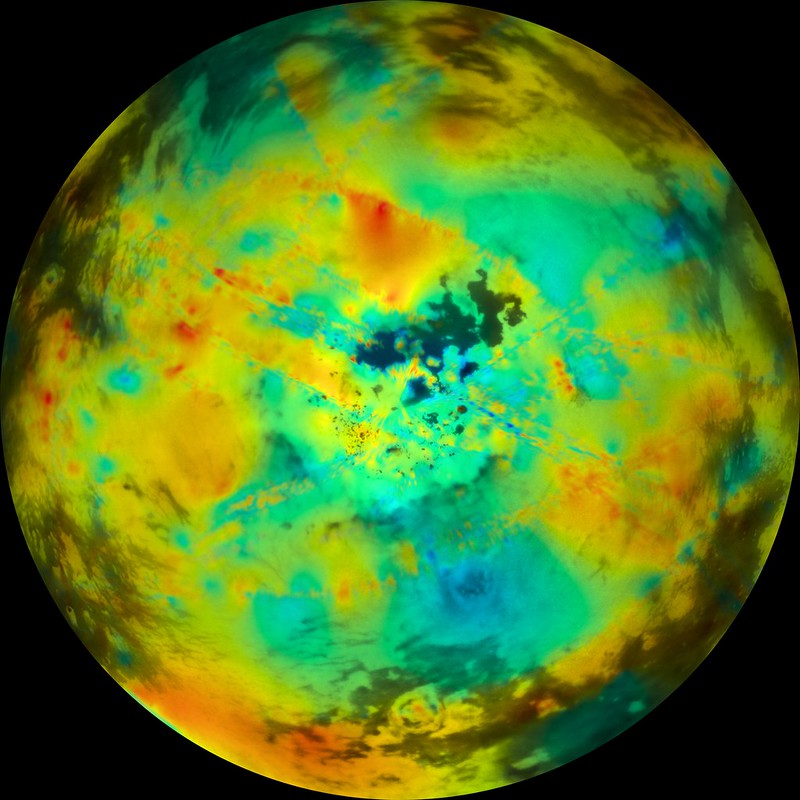 Cassini ISS Titan Mosaic & Topography: Northern Hemisphere (USGS/Ian Regan/P.Corlies et al.)
 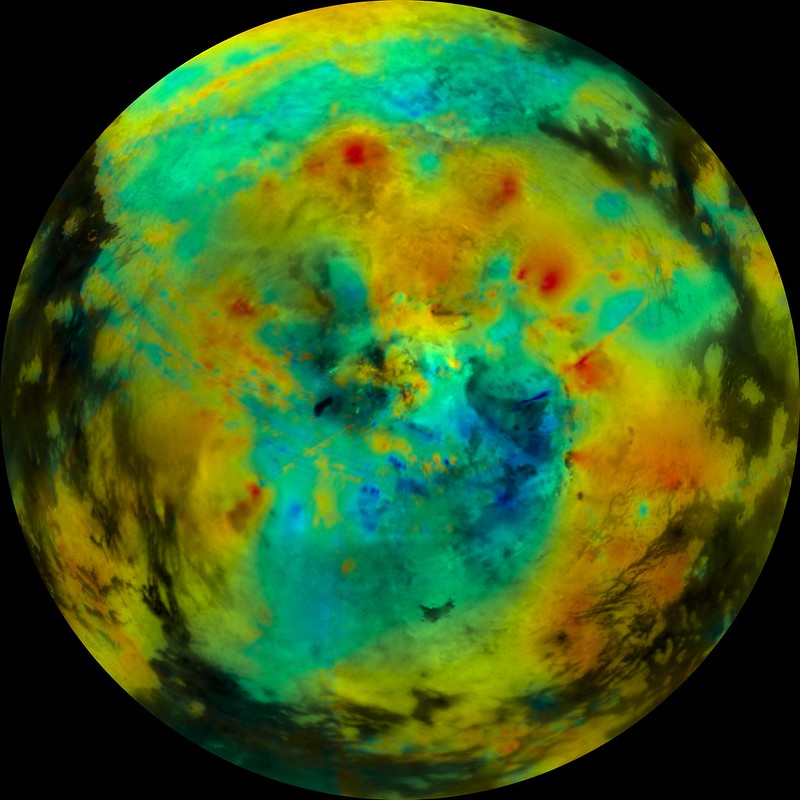 Cassini ISS Titan Mosaic & Topography: Southern Hemisphere (USGS/Ian Regan/P.Corlies et al.)
Blue areas represent low-lying regions up to -1,800 metres below the average. Red areas indicates peaks of up to 650 metres.
nprev
Jul 8 2018, 12:54 AM
Let me add my voice to the chorus of

...incredible work, Ian.
Interesting that there's a high region (...for Titan; pretty flat place, really) adjacent to the north polar sea complex. Gotta wonder if that provides orographic lift & enhances precipitation to feed them.
hendric
Jul 9 2018, 06:56 PM
Thanks for the amazing maps Ian. Titan, being the Hydrocarbon Moon, is rather beautifully rendered like a colorful oil sheen!
Bjorn Jonsson
Jul 11 2018, 12:20 AM
Awesome maps and clearly a lot of work that was required to complete them. Titan isn't exactly the easiest 'image processing target' to work on.
Daniele_bianchino_Italy
Jul 12 2018, 11:39 AM
Ian R Magnifico! You did what I always wanted. I was hoping for these maps !!
This is the most fascinating world after the Earth. No doubt.
The missions to observe Ligeia mare or Kraken sea closely are my dream, for my most important opinion of some primary mis-seals on Mars.
This is my Ligeia mare model 12x17 cm. Handmade. No 3D printer. I know, it's not perfect.
http://antidotumtarantulae.altervista.org/...are_Ligeia.htmlWhat color would you think of ethane-methane seas? I maybe I had to do this sea in black?
Ian R
Jul 15 2018, 07:54 AM
Perhaps a deep, black-ish-brown would be the right colour? Even so, it still looks great Daniele!
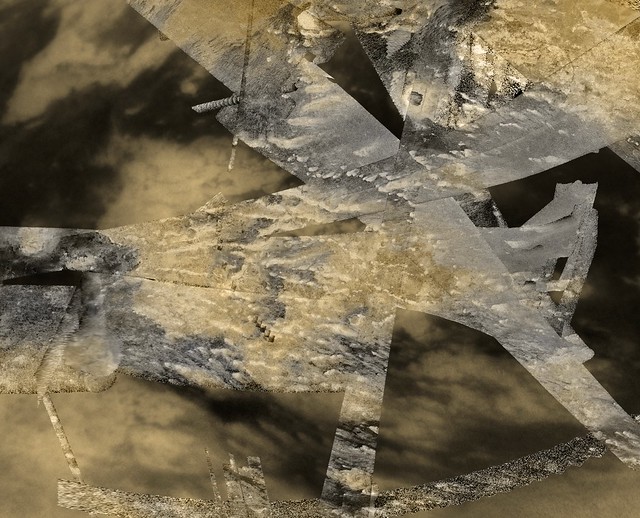
Ian R
Jul 15 2018, 07:56 AM
Another exercise in seam removal, but this time applied to stacked radar data from multiple Cassini flybys:
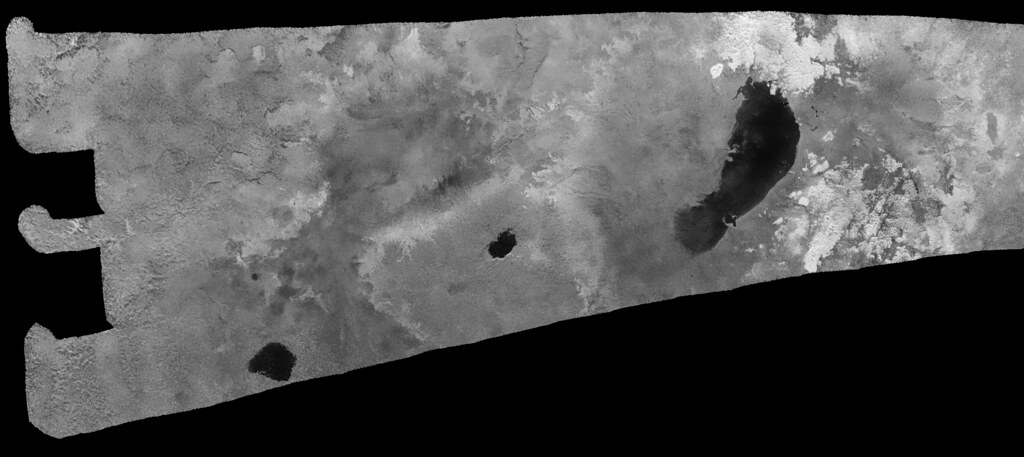
Ontario Lacus and Environs (T-39, T-57, T-58, T-65, T98)
Ian R
Jul 15 2018, 08:38 AM
sittingduck
Jul 15 2018, 02:49 PM
My goodness Ian those are phenomenal. Do you have plans to make more? I feel like I've never seen the lakes this clearly.
volcanopele
Jul 15 2018, 05:13 PM
That map of Ligeia is amazing. I like how visible the river that flows into NE Ligeia is (can see that in ISS data)
JRehling
Jul 15 2018, 05:54 PM
Ian, so much good work in every one of these products.
If I may, here is a brightened version of the Ligeia image, to emphasize details within the lake. It's clear that the channels continue well past the current shoreline, which would seem to indicate a lower surface level in the past.
Daniele_bianchino_Italy
Jul 16 2018, 05:54 PM
QUOTE (Ian R @ Jul 15 2018, 08:38 AM)
You are fantastic Ian R. If I had time I would do every possible lake of Titano .. probably I'll do Ontario Lacus or Kraken MAre.
jasedm
Jul 16 2018, 06:16 PM
At the risk of not actually adding anything to the discussion, I concur. These are fabulously clear views - congratulations to all for the hard work.
hendric
Jul 16 2018, 06:35 PM
Amazing work Ian, looks like we are flying over it! Ligeia looks to my like a Gryphon or large bird.
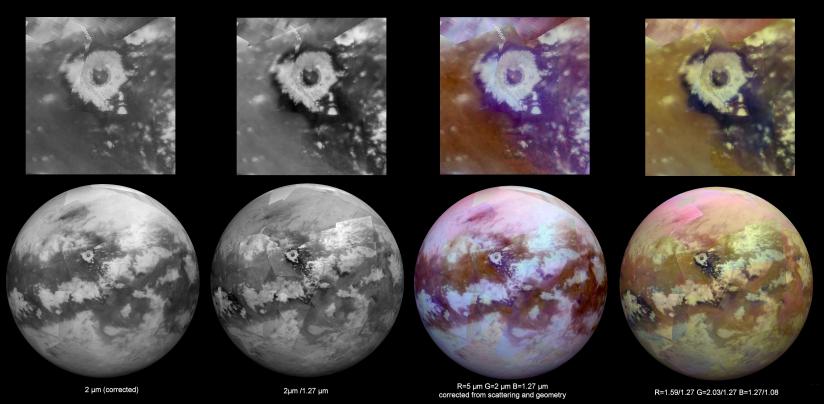
v7x
Jul 20 2018, 04:19 AM
Seeing Titan with Infrared Eyeshttps://photojournal.jpl.nasa.gov/catalog/PIA21923Is it possible we will get a map version of this?
Phil Stooke
Jul 20 2018, 04:09 PM
You have to have it as a map before it can be rendered as a spherical view. Eventually it will be released.
Phil
Phil Stooke
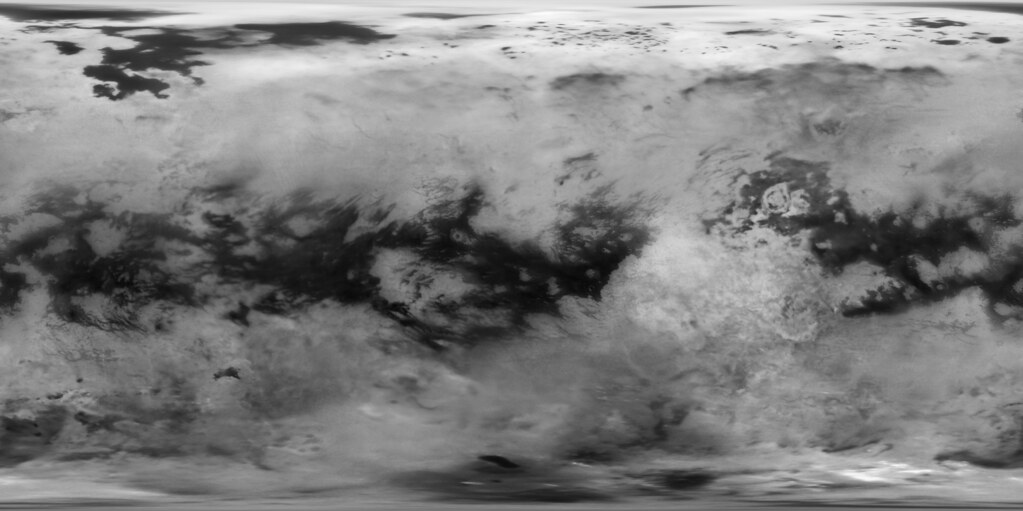
Mar 25 2019, 07:52 PM
Mind-boggling experience follws:
https://data.caltech.edu/records/1173A merged VIMS-ISS map of Titan. It is similar to the map projected into globes above.
Phil
JRehling
Mar 25 2019, 08:36 PM
That is really nice! Minimizes the seams and artifacts about as well as one could ask for given uneven coverage in the original data. Among other things, I really appreciate the way that Xanadu stands apart from the bright (but not AS bright) terrain to its south and east.
ngunn
Mar 26 2019, 07:55 PM
A splendid map indeed. I hope somebody decides to manufacture globes based on that.
JohnVV
Mar 27 2019, 02:20 AM
ngunn
Mar 27 2019, 08:13 AM
Very nice. Where do you get the relief information to generate the shading in those views?
This is a "lo-fi" version of our main content. To view the full version with more information, formatting and images, please
click here.