Here are some notes I gathered studying and experimenting with the C A H V O R E model, using Gennery (2002) and Di and Li (2004).
Each letter in CAHVORE represents a parameter of the camera model which allows for projecting a 3d point onto an image plane. The model is based on a conceptual description of the projection and its parameters are tuned to a specific camera in a careful, experimental calibration process. It is important to understand that this process is a least square fitting minimization of residuals tuning all 7 parameters simultaneously. This means, while each parameters has a meaning in the concept to derive the model, that the result of the calibration is not strictly required to coincide with a physical measurement. In practice, I believe the parameters mostly do follow an actual measure because they use careful starting guesses and because there are some constraints on the calibration.
C A H V characterizes a perspective view with a focal distance and an orientation where straight lines stay straight. O is needed when the optical axis is a bit off the camera axis.
R stands for rho and is the radial lens distortion parameter. E stands for epsilon and is the fisheye parameter. E is needed because R cannot capture distortion of very wide angle (>140 or so) lenses.
The model first applies E by considering a variable lens pupil location which depends on the incidence angle of the entering ray rather than a fixed pin hole. This has the effect of an apparent forward shift of the camera center C resulting in an effective center C' and can thus characterize wide angle lenses. Note that the description of how E is defined differs in Di and Li (2004) and Gennery (2002). Di and Li (2004) only briefly mention E and do not use it. Gennery (2002) is the basis for the NASA/JPL use of the model.
Then R is applied by using it to determine an apparent shift in the position of the imaged 3d point P to an effective location P'. This shift describes the lens distortion. Finally, P' is projected onto the 2d image plane using the other parameters.
There are three types of the mathematical model: the general model, the fisheye model, and the perspective model. I believe they are distinguished for historical reasons and because they allow for simplified computations. The general model can represent the other models by using an additional parameter (L or P).
Since the calibrations occurs for all parameters simultaneously it is not really possible to apply the model partially. For example, for fisheye lenses both parameters R and E have to be applied. In fact, the exact mathematics described in Gennery (2002) should be probably used even if there may be other ways to describe the concept mathematically since it is those equations which are used for the calibration, at least these are the only ones which are accessible. Following these the model can be used to project a 3d point onto a 2d image, and Gennery (2002) describes a sanctioned process to do the reverse. However, only the orientation of the entering 3d ray can be recovered from a 2d pixel. Unfortunately, this involves numerically solving an equation for each pixel.
The MARSCAHV VICAR utility attempts to remove distortion by transforming an image from the CAHVORE model to the CAHV model. Apparently, the utility is not available publicly. From its description, it computes the orientation of the entering ray for each pixel as described, assumes a 3d sphere (of radius 1m) as the 3d point location, and then projects that 3d point onto an 2d image using the CAHV parameters.
I may try to reproduce that approach. If it works, an interesting experiment for the Nav helicopter images may be to assume a horizontal plane (normal to the camera axis) at 10m distance rather than 1m sphere to intersect the computed ray with. And then simply look at the map view, eg. take the x and y and ignore the z for an image.
Similarly, for the color RTE images, assuming a plane at a 22 degree angle to the camera axis for intersecting the reconstructed rays and looking at the map view could be tried.
Full Version: Perseverance Imagery
Let me share a quick experiment:
Since I have an old stereoscope,
Click to view attachment
I wanted to use it to view Greenish's stereo pair:
http://www.unmannedspaceflight.com/index.p...mp;#entry252728
From an original stereo photograph card I made a template and used it to scale and print Greenish's Ingenuity parallel stereo pair:
Click to view attachment
Perhaps that template could be useful. Here is a link to a shared Google doc slide ready to print at 100%: https://docs.google.com/presentation/d/17ki...dit?usp=sharing
Clamping the printed and cropped paper between the original card in the card holder and behind the corner wires worked pretty well. The stereo view through the stereoscope is immediate and effortless. The main limitation is the dpi and quality of the print (the nominal 1200dpi was pretty good but could be better). It may be worth having images printed at the drugstore for that purpose if it is possible to control the exact size.
That's pretty classy, and entirely by chance that aspect ratio was pretty close. If I'd known I'd have been less slapdash with the upscale, crop & sharpen.
QUOTE (Andreas Plesch @ Jun 7 2021, 09:40 PM) 
. . . Since I have an old stereoscope, . . .
Since I don't have a stereoscope, I came up with another method. Here is one for owners of an old* 3D HD TV with polarized glasses to view stereoscopic Mars images in full color. Take a Mastcam-Z right eye image as the first layer in an image editing program. The corresponding left eye image needs to be rotated 0.6° counterclockwise to correct for the slightly different orientation. Then copy and paste it as a second layer onto the right eye image. Make the left eye image semi-transparent and move it so that the nearest objects match those of the right image. Cut off parts which contain content from only one image. Then reset the transparency of the second (left layer) to 0. If the image width is greater than 1920 pixels or the image height greater than 1080 pixels (for a full HD TV), scale down or crop the image. Smaller images can be scaled up. Now, if the image doesn't exactly fill 1920 x 1080 pixels, expand the canvas accordingly and fill the added parts with a neutral color. Any image processing (color adjustment, sharpening, etc.) must be done before the next step. Then copy the image "1920x1080_stereo_mask.png" and past it as a third layer over the others. Make a selection of all black lines. Make the third layer invisible, but keep the selection. Activate the second layer (left eye) and delete from it the selected areas (lines), then unselect. Remove the third layer. Reduce both layers to one in the background and save the image. If the computer is connected directly to the TV (e.g. with HDMI cable) and uses it as monitor, the image must be displayed in full screen mode. Now get your polarizing glasses and view Mars in 3D.Another option is to save the image to a USB device and connect it to the TV. My TV only accepts the jpg format with the baseline option, all other formats were ignored. It is recommented to save jpg in high quality.
Drawback of this method: the vertical resolution is reduced to 540 lines per eye.
If the picture looks strange (banding), check the overscan of the TV and set it to "off". If the 3D TV screen has a resolution other than HD, the method should be adjusted accordingly.
*old, because I'm afraid that 3D TVs are no longer produced
Attachments:
1) A stereo image from sol 108 ready for use
2) An anaglyph to show that it works
3) The stereo mask file to do it yourself
1 Click to view attachment. 2 Click to view attachment. 3Click to view attachment
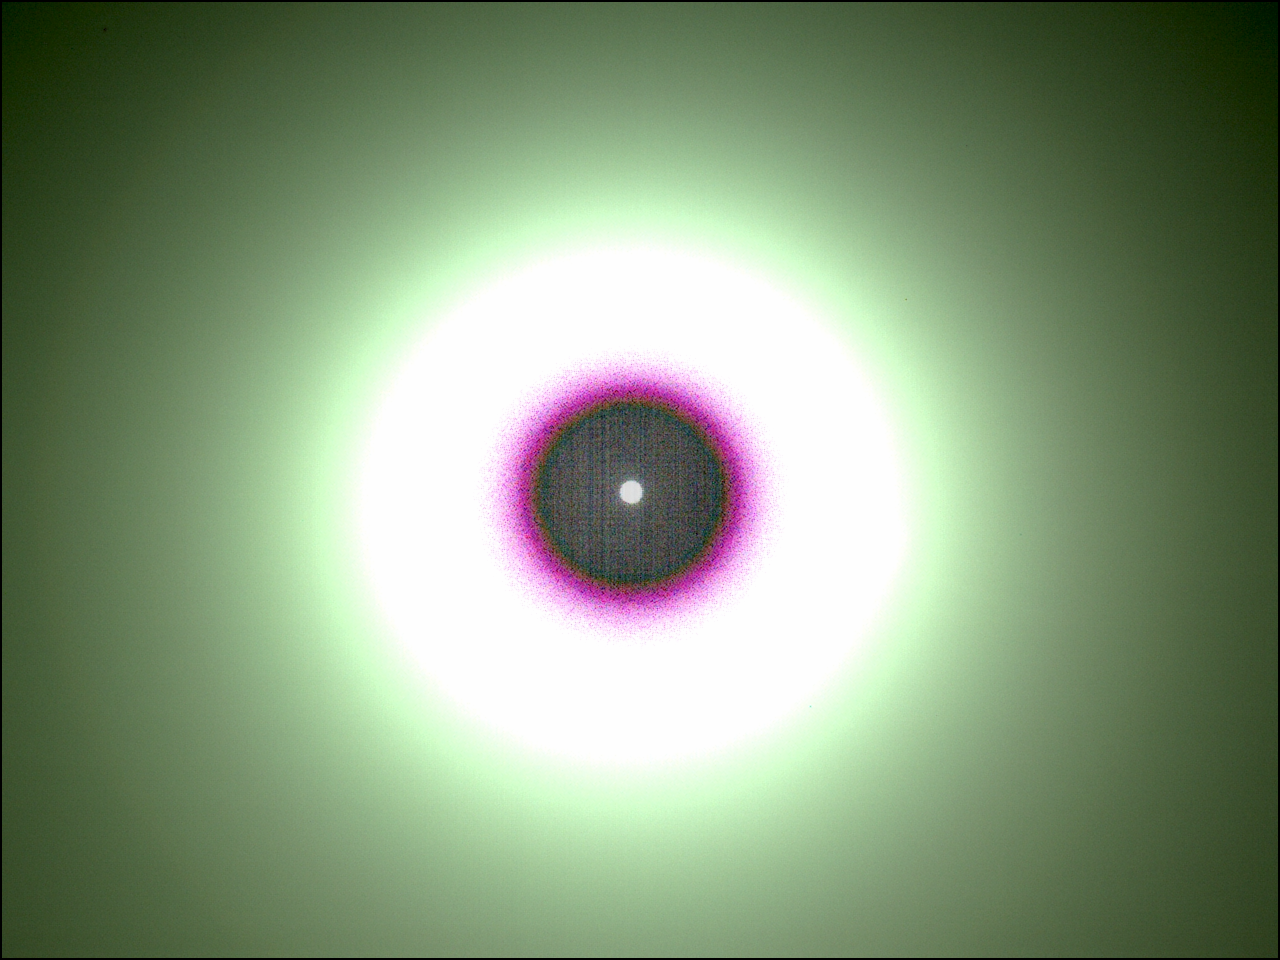
I'm not sure what we're seeing with these new navcams, eg:
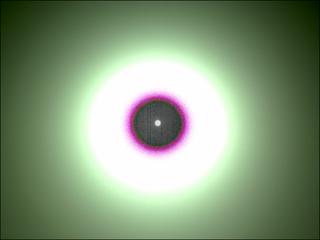
That appears to be the sun at centre, with diameter about right for a full-res navcam frame. Maybe some new version of the bleed-off subtraction mode? But I don't see how you could get an unsaturated solar disc image without a solar filter.
That appears to be the sun at centre, with diameter about right for a full-res navcam frame. Maybe some new version of the bleed-off subtraction mode? But I don't see how you could get an unsaturated solar disc image without a solar filter.
QUOTE (fredk @ Aug 1 2021, 10:47 AM)
but I don't see how you could get an unsaturated solar disc image without a solar filter.
google for "cmos black sun".
The digital version of the old film "solarized" image.
QUOTE (fredk @ Aug 1 2021, 09:47 AM)
...
That appears to be the sun at centre, with diameter about right for a full-res navcam frame. Maybe some new version of the bleed-off subtraction mode? But I don't see how you could get an unsaturated solar disc image without a solar filter.
That appears to be the sun at centre, with diameter about right for a full-res navcam frame. Maybe some new version of the bleed-off subtraction mode? But I don't see how you could get an unsaturated solar disc image without a solar filter.
Interesting bit to me, the little blob in the lower right of some of the images. I wonder if they were trying to capture an eclipse/transit. If it appeared in all the image, I'd just assume it was a lens flare.
https://mars.nasa.gov/mars2020/multimedia/r...PP00606_00_0LLJ
QUOTE (mcaplinger @ Aug 1 2021, 07:59 PM)
google for "cmos black sun".
Thanks for the tip. The black sun effect does seem to explain the large dark area inside the magenta ring. But I don't see how you can get what looks like an image of the solar disc at the centre of the dark area (it has about the right diameter to be the sun). If the surrounding pixels were saturated enough (due to scattering in the atmosphere or optics) for the reference levels to also be saturated, leading to near-black on subtraction, then surely the solar disc should also be saturated and also look black. Why wouldn't the black sun effect also darken the solar disc?
Maki etal describe the black sun effect as a problem for centroiding, and say they use a technique to bleed off charge from the reference so subtraction from the pixel value no longer gives black - I guess this is what's previously been done, but apparently not with these new images.
The only way I can think of to resolve the solar disc without an ND filter is through optical reflections - maybe that's what we're seeing, though it's not clear why that wouldn't simply further saturate those pixels and so darken the output values.
I have no idea if this function is onboard, but what about an onboard merge of a very short exposure and a longer exposure?
The shortest possible exposure for the ECAM's is 411 microseconds and the longest possible exposure is 3.3 seconds.
The shortest possible exposure for the ECAM's is 411 microseconds and the longest possible exposure is 3.3 seconds.
I was wondering about that too, but I'd be surprized if an unfiltered short exposure would show the disc, considering the dust in the air and scattering in the optics. Try that with your camera on Earth and you end up with an overexposed glow around the sun. Maybe with a good enough dynamic range sensor.
Is there automation available to rectify and project (at least mastcam) images?
Mars 2020 Mission Release 1 is live in PDS...time to start digging in to the documentation & calibrated goodies!
Gonna start with some light reading: Mars2020_Camera_SIS.pdf
Edit: looks like there's now a thread for Percy PDS data. I do lean towards continuing in this thread the conversation about the technical aspects of imagery now that the answers to many of our speculations are published...
Gonna start with some light reading: Mars2020_Camera_SIS.pdf
The NASA Planetary Data System announces the first release of data from the
Mars 2020 Perseverance Rover mission to Mars. This release contains raw,
calibrated, and derived data products covering the first 90 sols of the
mission, February 18 to May 20, 2021. The data are archived at various PDS
Nodes. Links to all the archives can be found at
https://pds-geosciences.wustl.edu/missions/mars2020/
Data from the following science investigations are included in this release.
Mastcam-Z – Mast-mounted Zoom Camera System
Engineering Hazard and Navigation Cameras
Helicopter Cameras
EDLCam – Entry, Descent, and Landing System Cameras
MEDA – Mars Environmental Dynamics Analyzer
MOXIE – Mars Oxygen ISRU Experiment
PIXL – Planetary Instrument for X-ray Lithochemistry
RIMFAX – Radar Imager for Mars Subsurface Exploration
SHERLOC – Scanning Habitable Environments with Raman and Luminescence for Organics and Chemicals
SuperCam – LIBS, Raman, Time-Resolved Fluorescence, VIS/IR spectrometers, Remote Micro-Imager and microphone
SPICE – Observation geometry and ancillary data
Future releases covering sols during which sampling events occurred will
include ‘sample dossiers’ – collections of science and engineering data
relevant to each returnable sample or blank. No sampling events occurred
during the first 90 sols of the mission.
To subscribe to future announcements of Mars2020 data releases:
https://pds.nasa.gov/tools/subscription_service/top.cfm
Edit: looks like there's now a thread for Percy PDS data. I do lean towards continuing in this thread the conversation about the technical aspects of imagery now that the answers to many of our speculations are published...
QUOTE (Keltos @ Jun 17 2022, 05:53 PM)
Can you tell me (i have photoshop) how you do that : turn the raw into those enhanced images that show different minerals / different colors ?
I use Photoshop to convert the raw png images to uncompressed bmp format before computation, and after creating the principal components image to add the credit line,
sometimes for some minor optimizations (e.g. slight brightness and sharpness adjustment), and to save the image as compressed jpg format for upload to UMSF.
The main part is done with self-developed algorithms and source code in C++ and Visual C++.
The principal components algorithm I translated and adapted from a Basic language algorithm I found in a book from the year 1988.
The other important part is the scaling, translation, and rotation of the numerical results and their projection into the RGB color space.
This part of the code is reworked with each new raw image series to get a satisfactory result.
The resulting image does not always look good (I do not upload these to UMSF).
It should be noted that the resulting principal component coefficients depend on the overall image content.
Any change in the multispectral values in one part of the image will result in an overall change in the colors in the entire image.
In addition, the flatfield inhomogeneities of the multispectral filters (especially the infrared filters of the Mastcam Z right eye) have a strong disturbing effect.
The resulting colors are somewhat dependent on chance, and it is not guaranteed that different minerals will appear in different colors.
Edit
Meanwhile, I use multispectral sky images from sol 604 for a rough flatfield correction.
A visual explanation of the image processing you can find in post #170.
We have had some inquiries over the years about color calibration for the Mars2020 cameras. For WATSON, the best I can offer is the attached image from the calibration dataset (see https://www.researchgate.net/publication/34...ibration_Report ) This image was taken with 100 msec exposure time, 8-bit linear divide by 8 encoding, and is Bayer-interpolated but otherwise straight out of the camera. It was illuminated by a commercial halogen worklamp (Britek Halo Flood Twin 1200S) with two 500 watt bulbs with a stated color temperature of 3150K. The light source was not calibrated and the geometry was not recorded.
The target is a commercial "Macbeth ColorChecker" ( https://en.wikipedia.org/wiki/ColorChecker ) made by X-Rite and purchased sometime around 2010, I'm guessing. These charts have gone though a variety of manufacturers (they're now made by Calibrite) and I don't know how their colors may have varied; we made no attempt to measure this one.
Click to view attachment
QUOTE (mcaplinger @ Nov 11 2022, 06:51 AM)
....For WATSON, the best I can offer is the attached image from the calibration dataset (see SHERLOC WATSON Camera Pre-delivery Characterization and Calibration Report...
Thanks for that information (from me and others)
Were you involved in testing the other cameras such as the NavCams pre launch?
If so, is there any publicly available information that you could share (such as released calibration reports / calibration targets used for any of the other M20 cameras)
I was involved in the data taking for Mastcam-Z but responsibility for calibration rests with a working group of the science team. There is an open literature paper on that: https://link.springer.com/article/10.1007/s11214-021-00795-x
I didn't have anything to do with Navcam.
There's supposed to be enough info in the data product SIS to answer any question one might have.
I didn't have anything to do with Navcam.
There's supposed to be enough info in the data product SIS to answer any question one might have.
QUOTE (mcaplinger @ Nov 21 2022, 12:45 AM)
I was involved in the data taking for Mastcam-Z but responsibility for calibration rests with a working group of the science team. There is an open literature paper on that: https://link.springer.com/article/10.1007/s11214-021-00795-x
I didn't have anything to do with Navcam.
There's supposed to be enough info in the data product SIS to answer any question one might have.
I didn't have anything to do with Navcam.
There's supposed to be enough info in the data product SIS to answer any question one might have.
Many thanks

Here's what we have so far with a mosaic from the PDS for Sol 539 using the .png images on the web browser index. Individual contrast stretching was needed and the color balance is different between the lower and upper tier of NavCam images. The "RAD" images were used among the choices. The images are more uniform, since for example the vignetting was removed upstream.
Click to view attachment
A somewhat improved matching between lower and upper tiers is now in place for Sol 539 within the drive movie. Here is a large format version of this frame.
Click to view attachment
A somewhat improved matching between lower and upper tiers is now in place for Sol 539 within the drive movie. Here is a large format version of this frame.
If you have not already done so, you should read this post first.
Thorough information about PCA (principal components analysis) you can find here on Wikipedia.
Raw material for my image processing is a set of six multispectral images from Mastcam-Z left eye (ZL1...ZL6) or right eye (ZR1...ZR6).
Sometimes I use RGB images (ZL0 or ZR0) when no multispectral images are available.
I use the pixel values of the six multispectral images (or of the three RGB channels in a RGB image) as variables to calculate the first three principal components.
Sky is excluded (masked) from calculation of the principal components, but resulting coefficients are applied to the sky, too.
The image below is a visual explanation of numerical processing steps based on PCA results.
Click to view attachment
A very short summary: It is "painting by numbers".
Tau, thank you for all your efforts to explain the procedure.
I can get the three primary components easily, as the following image shows.
Click to view attachment
What I still struggle to understand is how the rotation in RGB color space (steps r2 and r3) and the resulting blend (pc2+pc3) are accomplished.
I can get somethng resembling your final product by performing some band gymnastics,
Click to view attachment
but I'm obviously still doing something wrong.
I would really any pointers you can give, thank you in advance.
Here is a schematic sketch of what is meant by the rotation in the RGB color space from the gray axis to a perpendicular plane.
The color axes of PC2 and PC3 are also perpendicular to each other.
Click to view attachment
Usually, only the resulting image PC1+PC2+PC3 in my previous post is created.
All other partial images are just illustrations of intermediate numerical calculation steps.
The calculated principal components pc1, pc2, pc3 are centered around 0 (coordinate origin).
Scaling and translation:
PC1 = a1*pc1 + b1, where b1 is about 128 (center of the RGB cubus with values 0...255)
PC2 = a2*pc2 + b2, where b2>0 for a more rust-colored Mars
PC3 = a3*pc3 + b3, where b3≈0
Vector addition with rotated PC2 and PC3 in RGB space:
R = PC1 + 0.707*PC2 - 0.408*PC3
G = PC1 + 0.816*PC3
B = PC1 - 0.707*PC2 - 0.408*PC3
If any of the values of R,G,B is less than 0 or greater than 255, find the point where the perpendicular line from (R,G,B) to the gray axis meets the cubus surface.
If the resulting image has unusual colors (e.g. yellow basalts, greenish dust in ZL0 images), replace a2 and/or a3 with their negative values.
Click to view attachment
Tau, big thanks, it appears it had worked.
I've noticed that a lot depends on how you scale your bands. There was a lot of trial & error, before I succeeded. Also some wild color permutations.
I still have a lot of details to iron out (like flattening the atmosphere), but I finally get the idea.
It is a very elegant analysis tool.
I really enjoy Tau's false colour renditions and now yours kymani. They take me back to the early days of Spirit and Opportunity where it was, and indeed still is, such a useful tool particularly in the identification of hematite. In false color the vistas of hematite concretions were at times stunning and it provided a pseudo scratch test of fines from Opportunity's grinds. Thank you for your efforts with tools more sophisticated than I was used to.
Thank you very much The software has really come a long way since MER rovers, but those were more romantic times in exploration of Mars.
I was also intrigued by tau's processing, so I feel over the moon now for learning the procedure.
So the credit is all his. But I have several ideas how to apply this newfound knowledge to some datasets. Will be posting first result in short time.
I was also intrigued by tau's processing, so I feel over the moon now for learning the procedure.
So the credit is all his. But I have several ideas how to apply this newfound knowledge to some datasets. Will be posting first result in short time.
This is a "lo-fi" version of our main content. To view the full version with more information, formatting and images, please click here.