Page-6
Schedule on 6 December 2015
6/Dec daytime attitude change
7/Dec 04:30 Usuda station visible starts
08:22 Akatsuki enter Venusian shadow
08:51- fire attitude control engines, data acquisition/confirmation
11:30
12:00 explanation to the presss re firing
afternoon transfer to Camberra station
afternoon attitude change
Note:
At time of press conference the only known fact will be the result of engine firing.
Whether or not the intended orbit insertion is a success can only be confirmed during 7-9 December.
About that confirmation a seperate press conference is scheduled for 18:00 on 9 December.
P
Full Version: Akatsuki Venus Climate Orbiter
Page-7
Orbit diagram at time of orbit insertion attempt (helio centric)
(On this page there are 3 main components, orbit diagram on left, box above and box below. The box below is the blow up of
the small box on the orbit diagram. The character set at the lower left bottom = Helio centric orbit diagram)
(Box above):
1. Currently, Akatsuki is flying ahead of Venus
2. From around 1 December Akatsuki will be flying outside of Venusian orbit. For this reason Akatsuki's speed will be less
and as a result Venus will catch up with Akatsuki.(Distance between them will become less)
3. On 7 December Venus will ovetake Akatsuki and at that instant velocity reduction will be attempted for orbit insertion
(Box below):
Upper left character set: Red circle=Venus position, square=Akatsuki position every other day
Lower right character set: Expansion of insertion details, helio centric orbit
Character sets upper right to lower left along orbit are:
(Red line=Venus, green line=Akatsuki)
1 December 2015
Approach from outside
Attitude control:(A)+Z Sun attitude->(B)VOI+R1 attitude
7 December 2015
Venus orbit insertion
(On the orbit diagram itself):
Outermost is Earth, red circle is Venus, green circle is Akatsuki
Character sets with numbers are all dates, 12=December
Character set along 1AU = 8 minutes 19 seconds
P
Page-8
(page title):
Orbit at time of insertion attempt (Venus centred)
(Blue box at top right is the same as that on page-7, therefore not translated)
1: (about the largest box on lower right)
(Top left corner is ): at time of VOI-R1 and the red arrow pointing to the sun, and the blue to earth.
(At bottom right corner there are 3 lines of character sets. These are, from top down):
○ is every one hour.
Expansion of insertion sequence
Orbit with Venus at centre
(Along the orbit lines, character sets outside the orbits in clockwise direction are):
Akatsuki (near circled number 1)
Shadow
VOI-R1 firing
VOI-R1 firing as neccessary
In the case of no VOI-R1 firing
(Inside the orbit curvature):
Venus
Direction of Venus motion
2: (about the orbit diagram on left)
(There are two oblong boxes here):
(Box on left reads):
Furthest Venus height 480,000-500,000 km
Dec. 2015 - Mar. 2016
(Box on right):
Furthest Venus height 310,000-330,000 km
Around April 2016
(Character sets ouside the closed orbits clockwise):
Akatsuki's motion
In absence of VOI-R1 firing
(inside the smallest closed orbit): Venus motion
P
Page-9
(page title): Engines to be used
(inside red framed box): Attitude control engine/top side (23N), used for orbit insertion
(inside blue framed box): Attitude control engine/down side (23N)
(character set at very bottom):
In order to make the craft into VOI-R1 orientation (sun is in the jet direction) on one day before (6 December 2015) VOI-R1 firing
will be conducted using the top side (+Z) attitude control engine which can best tolerate the solar beam input.
Page-10
(page title): Attitude changes before and after VOI-R1
(on the left hand orbit diagram):
(A)+X Sun
( VOI-R1 attitude
© VOI-R1c attitude
(D) Venus observing attitude
(yellow stars indicate attitude change positions)
(upper left arrows): sun direction in red, earth direction in blue at time of VOI-R1 operation
(on the right hand 4 blocks):
(character set just above these 4 blocks): craft attitude as seen from earth
(4 blocks clockwise are):
Blk1: (A)+Z Sun attitude
Blk2: (B)VOI-R1 attitude
Blk3: (D) Venus observing attitude
Blk4: © VOI-R1c attitude
P
(page title): Engines to be used
(inside red framed box): Attitude control engine/top side (23N), used for orbit insertion
(inside blue framed box): Attitude control engine/down side (23N)
(character set at very bottom):
In order to make the craft into VOI-R1 orientation (sun is in the jet direction) on one day before (6 December 2015) VOI-R1 firing
will be conducted using the top side (+Z) attitude control engine which can best tolerate the solar beam input.
Page-10
(page title): Attitude changes before and after VOI-R1
(on the left hand orbit diagram):
(A)+X Sun
(
VOI-R1 attitude© VOI-R1c attitude
(D) Venus observing attitude
(yellow stars indicate attitude change positions)
(upper left arrows): sun direction in red, earth direction in blue at time of VOI-R1 operation
(on the right hand 4 blocks):
(character set just above these 4 blocks): craft attitude as seen from earth
(4 blocks clockwise are):
Blk1: (A)+Z Sun attitude
Blk2: (B)VOI-R1 attitude
Blk3: (D) Venus observing attitude
Blk4: © VOI-R1c attitude
P
Page-11
(Page title):
Akatsuki's health
Akatsuki is currently flying along an orbit nearer to the sun than Venusian orbit. Consequently it is experiencing a harder thermal
environment than originally planned.
Therefore, we changed its attitude so that the most heat resistance face (+Z) will point to the sun.
Akatsuki passed the 9th (final) nearest Sun point on 30 August 2015. At each point of the space craft the temp. is drecreasing
as predicted, showing that Akatsuki is in good health (except the main engine).
(on the left hand graph, vertical scale is solar radiation strength in W/mxm, and the horizontal scale is date)
(Character sets on the graph from top to bottom are):
Akatsuki (green)
Solar orbit (just above green dotted lines)
Transition (or transfer?) orbit (just above red dotted lines)
Maximum solar radation on 17 April at 3665 W/mxm
Venus (red in middle)
VOI on 7 December with 2621 W/mxm
Earth (blue in middle)
Launch 21 May
P
Page-13
(Note that page-12 does not have characters)
Akatsuki- Venus exploration
We wish to understand the climate of Venus which is often said to be very similar to the earth, by 3-D type
remote sensing into the cloud layers from orbit.
・ Why Super Rotation?, the high speed atmospheric motion
・ How can the atmosphere move vertically and north-south?
・ How are all covering clouds formed?
・ Are there lightenings in the absence of ice crystals?
・ Are there active volcanoes?
Page-14
Mysterious wind - Super rotation
Atmosphere rotates much faster than the speed of self rotation in the same direction (360km/h)
P
Page-15
Atmospheric circulation on earth type planets
(with the earth in 4th quadrant and clockwise)
(at 21:00 direction): Hudley circulation
(at 22:00 direction): Ferrell circulation
(just before mid night): Polar circulation
(on the globe from above, Westerly and Trade wind)
(in the 3rd quadarnt is Mars. Character in the top box is Winter and that in the bottom box is Summer.
On the globe at top is Westerly and below it is Trade wind. Outside the globe, horizontally across is Hudley and above it is Ferrell)
(1st quadrant is Venus with super rotation)
(2nd quadrant is Titan with super rotation)
Page-16
Clouds are formed by atmospheric circulation
(graphic here)
Clouds are responsible for planetary refletion and surface temperatures
P
Page-17
Various hypotheses about super rotation
(just below this page title on the right is an ellipse with red dotted lines. In it the character reads "acceleration zone")
(on the very lefthand narrow vertical gap are, top down):
stratsphere, clouds, and convection zone
(There are three graphics on this page, each with two character sets, top down):
(left hand graphic): Waves and random flow, Hudley circulation
(graphic in middle): Thermal tidal waves, Thermal tidal waves (never heard of this, P)
(right hand graphic): Gravity waves, Kelvin waves
(with each of these graphics characters at bootm from left to right are):
South pole, Equator, North pole
(below all these)
It is commonly assumed that some kind of huge waves are driving the atmosphere. Akatsuki wants to find out what it is.
P
Page-18
How are sulfulic acid clouds formed on Venus?
(against pale blue background just below page title above):
North-South and vertical cross-sections of Venusian upper atmosphere
(and just left of above): Height
(on this page there are 9 boxes. They are, anti-clockwise, starting from the first box, B1, which contains):
B1: H2SO4 is photochemically formed from SO2、H2O、CO2
B2: Upward transport of SO2、H2O ?
B3: Condensation of H2SO4 in upward stream?
B4: SO2、H2O、CO circulation
B5: H2SO4 decomposing into SO2、H2O
(This box is sandwiched by Equator on its left and Poles on its right)
B6: H2SO4 gas formation?
B7: Evaporation of H2SO4
B8: Transport of cloud seeds and CO
B9: Super rotation
P
Page-19
(Top): Venusian activities and lightenings
(Bottom): Venusian terrain obtained by NASA Magellan radar exploration
Page-20
Instruments on board Akatsuki
(Three blocks of characters on left)
Block1:
・ There are 6 instruments.
1.1 : 5 cameras covering ulyra violet to mid infrared range (IR1, IR2, LIR, UVI, LAC)
1.2 : Reference frequency generator for radio wave occultaton (USO)
・ Data from 4 cameras except LAC is all controlled, processed, and recorded by mission system consolidated processor (DE)
・ Against the craft total mass of approx. 500kg, the total mass of 6 cameras and DE is approx. 37kg.
(On the right hand graphic there are 8 purple character bloks. These are from top to bottom):
1. Consolidated processor for mission system (DE)
2. Lightening and atmospheric light camera (LAC)
3. Mid infrared camera (LIR)
4. Ultra violet imager (UVI)
5. 1 micron camera (IR1)
6. 2 micron camera (IR2)
7. Radio waves
8. Radi wave occultation (RS)
(On the same graphic there are 7 character blocks in white. These are from left to right, and then top down):
1. Sequence control and on board procesing
2. Lightening and atmospheric lights
3. Cloud top temp. and cloud top height
4. Sulfur dioxide and unknown chemical substances
5. Ground surface material, active volcanoes, and water vapour
6. Lower layer clouds, cloud top height, and carbon monoxide
7. Temp. distrbution with altitude and sulfulic acid vapour
(characters lower bottom are neglected as being plain)
P
Page-21
Scientific instruments (1)
1. 1μm camera IR1 (Univ. Tokyo・JAXA)
λ= 0.9、0。97、1.01 μm (window in near infrared region) filed of view 12×12°、1024x1024 pixels、detector SiCCD
-> lower layer clouds、 active volcanoes、surface materials
2. 2μm camera IR2 (JAXA)
λ= 1.73、2.26、2.32 μm (wind ow in near infrared region)、 2.02 μm (CO2 absorption)、1.65 μm (Zodiacal light)
field of view 12×12°、1024x1024 pixels、 detector PtSi
-> lower layer clouds、 seed size、 cloud top height、
lower layer carbon monoxide
3. Ultra violet imager UVI (Univ. Hokkaido・JAXA)
λ= 283、365 nm field of view 12×12°、1024x1024pixels、detector SiCCD
-> SO2 、unidentified absorbing materials
P
Page-22
Scientific instruments (2)
5. Mid infrared camera (Univ. Rokkyo・JAXA)
λ= 10 μm (width 4 μm ) field of view 12.4×16.4°、248x328pixels、 detector: uncooled borometer
-> cloud top height
6. Ligthening/atmospheric lights camera LAC (Univ. Hokkaido)
λ= 777、551、553、558、630 nm field of view 16×16°、8x8 pixels、detector: APD (32kHz sampling)
-> lightening discharge、 O2 /O derived atmospheric lights
7. Ultra stable oscillator USO (JAXA)
Radiowave occultation
-> Temp. and sulfuric acid vapour distrbution with height
P
Page-25
Wind velocity field from tracing cloud blocks
(inside square): Patterns move
(Caption for the largest graphic):
Wind trace vectors by Mariner 10 (NASA)
(at very bottm, lower left):
Examle of cloud vector tracing from ground stations
Page-26
Observation plan
(inside largest green box at top):
Global imaging:
Visualise, as 3-D continuous movies, changes in trace gases and clouds moved about by the high speed streams.
Also, monitor ground surface.
(inside small yellow box on left):
Look at cloud layer structure from their side
(inside pinkkish, purplish box down bottom left):
Radiowave occulation: Look at atmospheric layer structure by receiving radiowave signals at ground stations
that have gone through Venusian atmosphere horizontally
(inside pale blue box):
Close-up imaging: Micro structure 3-D monitoring of cloud unevenness, detection of lightenings at night
(character strings without box, near orbit):
Orbital period: 15 days until March 2016, and 9 days thereafter
P
Page-27
Instrument status
(bottom catption for left hand image):
Thermal radiation from cloud tops
(top caption for right hand image):
Venus at 600,000 km, closest approach since December 2010
(three charater strings at bottom):
1. Start up tests were conducted on LIR, UVI, and IR1 (to be talked about)
2. IR2 and LAC, not yet confirmed
3. 3 months after re-insertion will be spent on snspection
Page-28
Start up tests on cameras, October 2015
(at very bottom):
We can only see dark space and noise as there was no star in the field of view. We can at least confirm minimum health of cameras.
P
Page-29
Observation plan after orbit insertion
(above lefthand box):
Until end december 2015
(above righthand box):
Until March 2016
(below lefthand box):
With LIR、IR1(1μm)、IR2(2μm)、UVI cameras adjustments of exposure time etc. will be made based on imaging tests.
Each camera is expected to contribute test images.
(below righthand box):
We will gradually move to normal mode of observation. Images and movies will be made publically available.
Radiowave occultation observation will be done after March 2016. LAC observation will be after April 2016.
(on each of the diagrams characters in black read "Akatsuki's orbit")
P
Page-30
This is about sucess criteria and it has been covered in the latest JAXA report.
Page-31 to page-36
These are not science, mostly message campaign etc. such as :
http://global.jaxa.jp/messages/akatsuki.html
Message contributions form the Planetary Society numbered at 54,632.
Groups at 148,204 and individuals via internet at 57,378
From page-37 on there are some potentially interesting pages. So, translation will
continue for a few more pages.
P
QUOTE (pandaneko @ May 8 2016, 05:55 PM) 
From page-37 on there are some potentially interesting pages. So, translation will
continue for a few more pages.
P
continue for a few more pages.
P
Above is not exactly true if you read these pages. They are not directly relevant to Venus, except instrument specs.
Instrument sepcs have been covered before.
So, no more translation and this is the end of JAXA Nov 2015 report.
P
atmosphere animations from IR2 (in Japanese)
http://www.isas.jaxa.jp/j/enterp/missions/...ile/index.shtml
http://www.isas.jaxa.jp/j/enterp/missions/...ile/index.shtml
WOW. After I watched it about ten times, I noticed the slow morphing of features over time. This smooth animation was made from just 4 frames, so there was effort put into animating it nicely like this.
Obviously, this detail is due to clouds, not the surface: The surface rotates much more slowly.
IR2 (a term which conveniently is written in the Latin alphabet) images at 2.26μm, and the signal for this instrument is dominated by atmospheric variation at 35-50 km altitude. That will be true of all results mentioning 2.26μm, which can save all of us non-Japanese speakers from puzzling too much about what the text says.
Fascinating, its a 16-hour sequence.. I don't recall ever seeing cloud animations for venus, unless i missed it.
Chrome did a pretty good job of translating, so might come in handy.. here's a the current state with translation of that page:
Chrome did a pretty good job of translating, so might come in handy.. here's a the current state with translation of that page:
QUOTE
Is an image of the attention that "Akatsuki" is taken.
2016 May 23 [update] New
Venus night side of the moving image by IR2 camera [Click for larger image] [GIF: 5.5MB] © ISAS / JAXA
The original image [Click for larger image] © ISAS / JAXA IR2 videos of Venus night plane by the camera video was based on 2016 March 29, the Venus night side image taken from a distance 360,000 km in IR2 wavelength 2.26μm. Four original image has been obtained in the 4-hour intervals from 16 hours 03 minutes (JST). During 4 hours, clouds has moved approximately 10 degrees by the super rotation, so as to fill therebetween and a smooth moving by rotating slightly the original image by calculation. From the video, to understand as deformation and prevalence of clouds take in hand, if reduced to 2 hours and 1 hour imaging interval in a future of steady observation, it is possible to obtain a video of more smooth, high-definition, Venus atmosphere understanding of is expected to proceed at once.
QUOTE
2016 May 11, 2011 [update]
[Click for larger image] Venus pseudo-color image by the camera IR2 © ISAS / JAXA shooting equipment: 2μm camera IR2 shooting date and time: 2016 March 25 commentary: IR2 pseudo color of the Venus from 1.735μm image and 2.26μm image of night face. 1.735μm → red, 2.26μm → blue, and both average of → colored green synthesis. Many dayside light that covers the brightness is strong 1.735μm in the night side of the, is because that's near the day and night boundary has become Orange sexy. The difference subtle shades of the night side is considered to represent the differences in the size of the cloud particles.
[Click for larger image] Venus pseudo-color image by the camera IR2 © ISAS / JAXA shooting equipment: 2μm camera IR2 shooting date and time: 2016 March 25 commentary: IR2 pseudo color of the Venus from 1.735μm image and 2.26μm image of night face. 1.735μm → red, 2.26μm → blue, and both average of → colored green synthesis. Many dayside light that covers the brightness is strong 1.735μm in the night side of the, is because that's near the day and night boundary has become Orange sexy. The difference subtle shades of the night side is considered to represent the differences in the size of the cloud particles.
It's a challenge to get coverage sufficient to animate the clouds on Venus: Usually, a view covers only about 90° on the day or night side (whichever is being used), and it takes about 4 days for rotation to occur, so a given parcel of cloud is only seen for part of a rotation. It would be difficult to track the same area without interruption for longer than 2 days.
Thanks, Paolo
The caption is as follows.
Animation of Venus nightside by IR2 camera
This is based on the images taken at 360,000km on 29 March 2016 at 2.26 micron. Original 4 images were obtained every 4 hours
from 16:03 (JST). Within the 4 hour period it is seen that the clouds moved 10 times due to super rotation.
Calculated data were used to make the animation look smooth enough.We can clearly see cloud shape deformation.
As we shift to normal mode of observation the frequency of taking these pictures will increase.
2 hours, then down to 1 hour will make much smoother animations, helping us to understand the Venusian atmospheric motion
in a drastic way.
P
Big apologies!
not 10 times, but yes, 10 degrees! Actually, this Google translation, I did not read, before translation,
but it seems very good, actually
P
not 10 times, but yes, 10 degrees! Actually, this Google translation, I did not read, before translation,
but it seems very good, actually
P
Congratulations on your efforts being featured in Emily's latest Planetary Society blog entry, Pandaneko! 
QUOTE (nprev @ May 25 2016, 12:33 PM)
Congratulations on your efforts being featured in Emily's latest Planetary Society blog entry, Pandaneko!
Thank you and a big thank you, Emily. It is good to know that my contribution is formed into a coherent story.
To be honest, my understanding of the whole science tends to be fragmented when I
am translating. I can now take a step back and see the whole pictures!
P
QUOTE (Paolo @ Dec 7 2010, 07:30 AM)
Just for statistics: if successful, Akatsuki will become the eighth Venus orbiter, after 4 Soviet ones, 2 US and 1 European.
Remarkably, no Venus orbiter has ever failed before reaching the planet, unlike the many (10) lost Mars orbiters
Remarkably, no Venus orbiter has ever failed before reaching the planet, unlike the many (10) lost Mars orbiters
This is just accidental, is it not?
P
For what it's worth, here's my list of Venus missions.
1 "Mission" = 1 launch. Multiple entry probes on one launcher are listed as one mission.
My tally of orbiters agrees with Paolo's!
Click to view attachment
Comments/corrections welcome
Colin
[Edit: OK, I realise there's now a wikipedia page showing a table of Venus missions, making my own table a bit redundant. In my defence, I don't think the wikipedia page existed ten years ago when I first compiled my list!]
Since you list flybys - the table is missing Ikaros then. What's the P for under Type, Probe?
a short update with lots of new images. first Venusian year in orbit
http://www.isas.jaxa.jp/e/topics/2016/0729.shtml
http://www.isas.jaxa.jp/e/topics/2016/0729.shtml
Those images are great. What's impressive is the array of different wavelengths, some never seen before. I'm sure the data that's already been collected will alter our view of Venus's atmospheric dynamics. I can't wait to see the publications!
Just a little bit of information on Akatsuki observation as follows.
JAXA and groups such as Rikkyo University here reported on 17 January 2017 that there has been an arrow like pattern,
as long as 10,000km north-south on Venus. This pattern was seen at the cloud top level (approx. 65km)
of the sulfuric acid clouds covering entire Venus.
They believe that the pattern was produced as the atmospheric disturbance caused by the terrain below propagated to
the upper atmosphere. This pattern remained for more than 4 days undisturbed by the super rotation, an eastery wind
of more than 100m/second. Similar patterns were also observed at other times of observation.
Rikkyo University group noted the presence of a high land with more than 5km in height right bekow the pattern.
Their simulation confirmed that the pressure variations below 10km level spread through the atmosphere in wave like motion
and spread out to form an arc pattern at the height of 65km, affecting the cloud top temps as well.
P
Nature Geoscience article. Abstract with some small images.
http://www.nature.com/ngeo/journal/vaop/nc...l/ngeo2873.html
P
http://www.nature.com/ngeo/journal/vaop/nc...l/ngeo2873.html
P
a release in Japanese, with descent size images:
http://www.isas.jaxa.jp/topics/000826.html
http://www.isas.jaxa.jp/topics/000826.html
I read the paper in Nature geo. the impressive thing is that the feature was visible in the very first IR images, taken barely 5 hours after orbit insertion!
QUOTE (Paolo @ Jan 18 2017, 09:39 PM)
a release in Japanese, with descent size images:
http://www.isas.jaxa.jp/topics/000826.html
http://www.isas.jaxa.jp/topics/000826.html
Isn't this because the super rotation has such a low density thing, so not affecting the arc very fast and
perhaps only a small amount of energy (whatever the source) is required to drive the super rotation to a very
high speed?
P
Some unhappy news
http://www.isas.jaxa.jp/en/topics/000902.html
Although the images have been coming in pretty well over the last year, and some good Radio Occultation
experiments have been done, the electronics unit that drives the IR1 and IR2 cameras suffered an anomaly in December, so for now
those two cameras have not been returning data. Recovery efforts continue. The ultraviolet, thermal IR and lightning/airglow
cameras are unaffected and continue to operate.
Ralph
With the loss of the IR cameras coming about 10 months into the science mission, and with Akatsuki's orbit having a period of 8 days, it should have acquired up to 40 or so periapsis observations. That's still a wonderful return from the IR instruments if all those 10 months of data were successfully acquired. I'm looking forward to seeing the resulting research as publications come forth.
A new press release (in Japanese only, for the time being): http://www.isas.jaxa.jp/topics/001069.html
And the related new Nature Geoscience paper (beyond the paywall): Equatorial jet in the lower to middle cloud layer of Venus revealed by Akatsuki
http://www.nature.com/ngeo/journal/vaop/nc...l/ngeo3016.html
And the related new Nature Geoscience paper (beyond the paywall): Equatorial jet in the lower to middle cloud layer of Venus revealed by Akatsuki
http://www.nature.com/ngeo/journal/vaop/nc...l/ngeo3016.html
I'm not able to read the full article, and Google Translate renditions of Japanese may not be reliable, but I am once again appreciative of Akatsuki's results, and wonder perhaps the full text makes this if Akatsuki is once again seeing something new because of its unique instruments, or whether it is seeing something new because Venus in c. 2016 is quite different from Venus just a few years ago during Venus Express, Pioneer Venus, etc.
I've been imaging Venus in UV regularly this summer and a BAA alert was issued because of unusual patterns seen in some July 2017 UV images of Venus, including mine. (In fact, I initially thought I must have been doing something wrong when I saw them.) Venus's clouds and atmosphere are time-varying quite a bit more than what one sees in global scale imagery of, say, Saturn. Venus Express did a good job of monitoring Venus for many years, and Akatsuki has, possibly a shorter lifespan ahead of it, but we might learn some interesting things if we simply watch Venus from orbit for longer spans of time.
I've been imaging Venus in UV regularly this summer and a BAA alert was issued because of unusual patterns seen in some July 2017 UV images of Venus, including mine. (In fact, I initially thought I must have been doing something wrong when I saw them.) Venus's clouds and atmosphere are time-varying quite a bit more than what one sees in global scale imagery of, say, Saturn. Venus Express did a good job of monitoring Venus for many years, and Akatsuki has, possibly a shorter lifespan ahead of it, but we might learn some interesting things if we simply watch Venus from orbit for longer spans of time.
the paper is now on arXiv:
Equatorial jet in the lower to middle cloud layer of Venus revealed by Akatsuki
Equatorial jet in the lower to middle cloud layer of Venus revealed by Akatsuki
JAXA has released an image of Venus showing also the Earth and the moon: Venus image with the Earth and also the Moon!
but what is more interesting are the links to archived and calibrated Akatsuki images:
UV1
IR1
IR2
LIR
but what is more interesting are the links to archived and calibrated Akatsuki images:
UV1
IR1
IR2
LIR
Augh, the site is timing out for me. If I can get my hands on these data I'll rehost it on our Amazon S3 server. I'll keep trying.
it worked this morning (European time) but now it's timing out here too
It's working for me now, for what it's worth.
Maybe there was a traffic spike when it was first published.
I love this data, and it is tantalizing, because I took two Venus images in UV in December 2016. At that point, Earth had an almost opposite perspective but I can see a match between the larger features in these images and one that I took.
I (and other amateurs) took many UV images of Venus from the same perspective as there images in mid-2017. I can't wait to see Akatsuki's images from that time. In particular, there was an interesting phenomenon regarding which the British Astronomical Association sent out an alert in late July 2017 for more observers: Venus had two dark bands in UV, making it look almost like Jupiter. I got one picture of it before my weather hit a bad streak of morning fog. Akatsuki was certainly capable of revealing this in more detail.
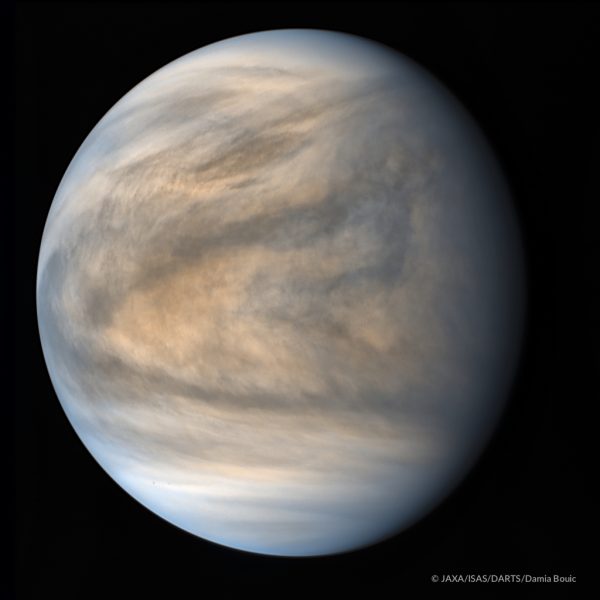
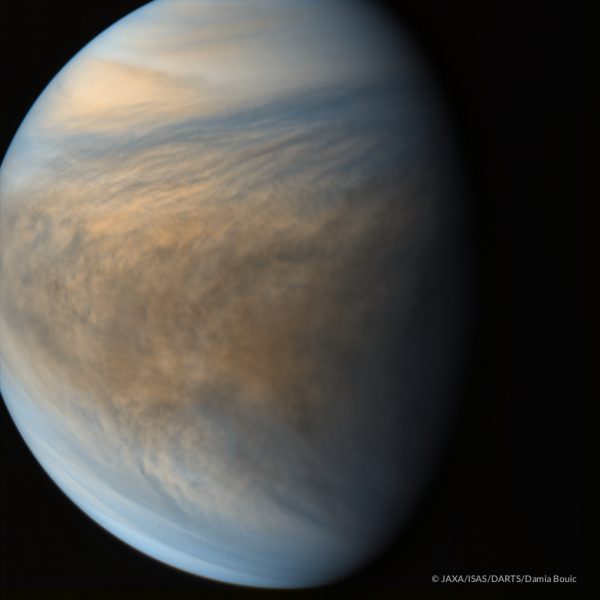
I did some processing by myself after a dive into the RAW imagery of the spacecraft, concerning IR2 and UV1 imagers.
Here is some results I would like to share
IR2 in false colors :

UV1 in false colors :
A little bit more here.
Here is some results I would like to share
IR2 in false colors :
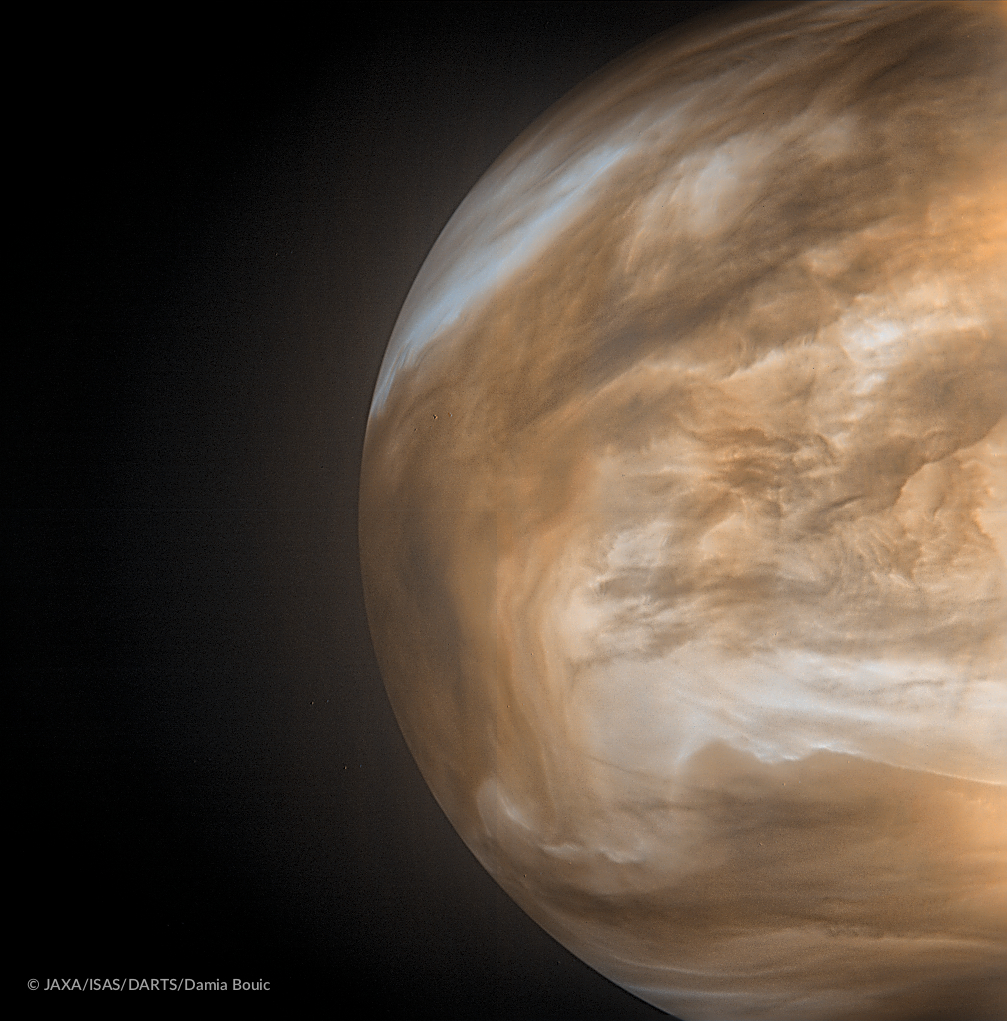
UV1 in false colors :


A little bit more here.
Wow! Awesome. Thanks Ant....
P
P
This is clearly a very interesting data set. These are some of the best images of Venus I've ever seen.
Thanks, Paolo
I have translated this article as follows for those who do not go into the walls. P
29 August 2017
Hitherto unkown jet stream found in the Venusian atmosphere
Outline
Akatsuki's onboard instruments can make observations through layers of thick clouds in the atmosphere of Venus. We examined
Akatsuki data in order to find the wind velocity and found that some time during 2016 the wind flow in the lower to mid cloud layers
(altitude of 45 to 60 km) formed a jet stream like structure (note: 1) with an axis near the equatorial region.
We now call this "equatorial jet". Up until then it was thought that the wind velocity at these altitudes have high horizontal uniformity
(note: 2) with little temporal variation, but we now know that there are signigicant variations beyond our previous expectation.
The behaviour of Venusian atmosphere is such that the wind velocity from the ground up to cloud top level (70km altitude) increases
rapidly, exceeding the velocity of self-rotation, and it is called "super rotation". We do not yet understand its mechanism. We hope that
this newly discovered equatorial jet formation and its formation theory will help understand the mechanism of super rotation by
numerial simulation.
Main text
Venus is covered by thick clouds between 45 to 70 km altitudes and the visual appearance of Venus is due to the reflection of Sun light
by these clouds. Venus is close to the earth in size and its rotational orbit around the sun is also similar to the earth rotation.
However, similarity ends there. Almost all of Venusian atmosphere rotates far faster than its own self-rotational speed. For instance,
the rotational period of Venus is 243 days and it is relatively slow, but at an altitude of about 70km the atmosphere is rotating 60 times
as fast as its self rotational speed. It is called "super rotation" and it is hoped that Akatsuki's data will help understand more about
this super rotation.
It is not possible to see through these clouds with visible light, but a limited range of IR can see through them. Akatsuki's IR2 camera
can observe the silhouette when the infrared light due to thermal radiation of the lower clouds goes through the clouds. In particular,
it enables us to visualise the thick mid to lower layers (45 to 60 km range) of cloud formation. (figures: 1 and 2)
Obervations similar to Akatsuki IR2 were conducted by the European Venus Express (2006-2014) and others. However, satellite orbit
limitation and visibility restrictions meant limited observations of the low latitude region. Consequently, it has been thought that
the wind velocity in this range of altitude is horizontally uniform with little temporal variation.
In our research we extensively used the highly reliable cloud chasing technique developped by the team led by Prof. Horinouchi.
It enables us to examine closely the horizontal spread of atmospheric flow by cloud movements. (note: 3)
Fig. 1: Night side observation (image only)
Image down load:[JPG: 3.1MB: (3840x2160px)] [JPG: 1.1MB: (1920x1080px)]
Fig. 2: False colour image of night side cloud pattern by IR2
Fig. 2a: 図2a:False colour image of night side cloud pattern by IR2
Darker (blacker) areas have thicker layers of clouds (because there are more cloud forming particles shutting out the IR radiation
coming from lower regions of the atmosphere). White area to the left is the day side.
© PLANET-C Project Team
IR2 camera false colour images were rendered into an animation. Images were obtained during 11th to 12th of July 2016.
Fig. 2b: IR2 camera false colour images were rendered into an animation. Images were obtained during 11th to 12th of July 2016.
© PLANET-C Project Team
While trying to find wind velocities from the IR2 images we discovered, from observatios during July 2016, the existence of
equatorial jet. (Fig. 3) This equatorial jet continued to exist at least for 2 months after this point.
Prior to June Akatsuki's orbit meant very limited observation of the night side, but we know that the wind velocity in the low lattitude
region was a little smaller and there was not jet like structure.
The discovery of the horizontal structure of wind velocity that the wind velocity becomes exceptionally faster in the low lattitude region
is thought to be significant, because there has been no such example even in the regions of high altitude including cloud top level
by a lot more of earlier researches, let alone the research in the less observed middle to low altitude layers.
Fig. 3: Example of east-west winds from our research
This example is based on the data from 11th to 12th July 2016. The velocity is the average over east-west 3000km region at each
latitude. Unit is m/s and N is northern hemisphere and horizontal bars are estimated error bars.
At this time an equatorial jet stream with an axis at around 5 degrees north is seen. Since equatorial jets extend east-west this fig. can
be thoght of its north-south cross section. For your informaion, the lattitude of the axis shifted slowly during the observation period.
The curve in the figure with an annotation such as "5 days" indicates how many earth days are needed for that particular wind velocity
to make one complete east-west travel around Venus. © PLANET-C Project Team
The reason for the equatorial jet stream formation is unkown, but we believe that there are only a few mechanisms which can explain
this phenomenon. Since these limited candidates are also related to super rotation it is expected that further research will lead to
theoretical understanding of not only the localised jets but also super rotation itself.
We also note the discovery of huge arc structure made by Akatsuki's middle IR camera on the cloud top level. Nobody had expected it.
We now know that the properties of these huge arcs can provide information on the near ground level state of Venusian atmosphere,
which is difficult to achieve with other means.
We will continue with data analysis and and apply the result into numerical simulation for understanding of super rotation.
Appendices:
Note 1: Jet (Jet stream)
Flow region of fast wind which looks like a band. Usually, the fastest (jet axis) is surrounded by less fast wind streams.
Note. 2: Horizontal uniformity
As stated in Note.1 jets have fatser and less fast portions. Consequently, jets are not horizontally uniform.
Fig.3: Recently developped very reliable cloud chasing method
Previous methods used 2 subsequent images, but this new method used a large number of temporal images.
Further improvements are being made.
I've been away from this thread for far too long. Thank you for the translations Pandaneko, and for the images Ant103!
One fine point about the main text. I think the visual appearance of Venus can be considered to be influenced both by clouds and the clear atmosphere. If the clouds have an optical depth of about 30 and the clear air of ~15, then both would be able to scatter light back out to space. It's true most of the light we see (about 75%) is scattered back by clouds. However it's interesting to note that if Venus had just the gas and no clouds it would still be just about as bright. Contributing to this is the fact that clear air scatters light more evenly forwards and backwards, whereby clouds do more forward scattering.
This is a "lo-fi" version of our main content. To view the full version with more information, formatting and images, please click here.