Thank you. That graph is so cool...
I think I just got myself seasick imagining being at the end of a tether yo-yoing back and forth from the yank of parachute deployment.
Full Version: Phoenix Final Descent Trajectory
Oh wow - that IS good stuff....
For excel-monkeys like me - keep CSV's coming
Doug
For excel-monkeys like me - keep CSV's coming
Doug
Is there a good way to get the actual orientation and pixel scale of the color Phoenix on the ground MRO image? If there is, it becomes possible to plot the final latitudes and longitudes of the last bit of the landing and answer the question posed by the first picture in this thread.
QUOTE (jmknapp @ Jul 31 2008, 12:07 PM) 
Here's a CSV:
PHX EDL CSV
The fields are:
1. UTC date & time
2. spacecraft ephemeris time
3. PHX subpoint longitude
4. PHX subpoint latitude
5. PHX altitude (km)
6. PHX speed (km/s)
7. PHX acceleration (g)
8. X coordinate (IAU_MARS)
9. Y coordinate (IAU_MARS)
10. Z coordinate (IAU_MARS)
11. X velocity (km/s)
12. Y velocity (km/s)
13. Z velocity (km/s)
Note that the altitude is relative to the idealized tri-axial ellipsoid model of Mars, & since the northern plains are below that model, Phoenix lands at "altitude" -2.74 km!
I can do the conversion myself but it might already be out there on the web. Is there a table of the above trajectory in the following coordinates:
altitude above a stated reference (MOLA)
free stream velocity (state if inertial or relative)
velocity angle with respect to the local horizon (state if inertial or relative)
azimuth angle (state if inertial or relative)
latitude (state if areocentric or areographic)
longitude
kwan3217 said:
"Except for reference area, the 70deg aeroshell is exactly the same as Pathfinder, which is reasonably well documented at ntrs.nasa.gov . It's the same shell all US missions have used since Viking. I remember readng presentations comparing all of them, and like I said, aerodynamically they all act identically when using the proper reference area. Unfortunately, the best curve I saw for Pathfinder was of actual Cd (only) as a function of mach number, but only along the entry corridor it actually experienced. Cd really is the most important thing. As far as Cm and such go, the center of pressure at hypersonic speeds is always a bit behind the center of mass, so it is stable."
The problem with the 70 deg. aeroshell is there are too many aerodynamic models. Martin-Marietta developed an extensive model for Viking but unfortunately that model was based upon wind tunnel results in air and NOT carbon dioxide (real gas effects were bogus). The aerodynamic model has evolved considerably since Viking. NASA Langley has the best model based upon CFD work. However there were several published variations of the NASA Langley model. There must be a canonical model that JPL believes in.
The aeroshell center-of-pressure doesn't change much when Mach > 6 [hypersonic limit] but begins to move forward as Mach number drops below Mach = 6. By the time Mach = 1.8, the center-of-pressure is almost of top of the center-of-mass and the vehicle is dynamically unstable (you need to pop the parachute before then). When Mach < 1.8, a 70 deg. sphere-cone will become statically unstable. This phenomena almost caused the Viking aeroshell to tumble. The Viking RCS was blowing lots of propellant prior to parachute deployment because the aeroshell was dynamically unstable.
The Phoenix EDL is extremely interesting in the context of trajectory software and aerodynamic model validation. Please correct me if I'm wrong but it's my understanding the Phoenix was despun prior to hitting the atmosphere and flew a lifting trajectory without RCS. MER and Pathfinder were both spin stabilized and flew ballistic entries. Viking flew a lifting entry and was 3-axis controlled but constantly banging its RCS. Phoenix should have a perfect trajectory for code and model validation. I'm sure there are lots of interesting real gas aerodynamic effects that can be extracted from the flight data.
QUOTE (djellison @ Jul 31 2008, 12:14 PM)
For excel-monkeys like me - keep CSV's coming
Here's one with 5msec resolution (warning: 90,000-line CSV file):
PHX EDL CSV (4MB zip file)
QUOTE (jmknapp @ Jul 31 2008, 06:48 PM)
90,000-line CSV file)
Sweet.
Goody goody goody....keep the awesome graphs coming...I love that you can see the three individual leg deployments!!
--Emily
--Emily
On the CSVs with velocity, make sure you specify the coordinate system, particularly whether it is inertial (J2000 or MME) or rotates with Mars (IAU_MARS). This is the difference between inertial velocity and airspeed (discounting wind). To get geodetic latitude, longitude and altitude, use IAU_MARS coordinates and run it through the code described here (fortran, but short and easy to translate) http://www.astro.uni.torun.pl/~kb/Papers/geod/Geod-BG.htm . The ellipsoid used with this spice kernel is a=3396.19km, b=3376.20km, centered on Mars center of mass, b axis=polar axis
Once you have the geodetic latitude and longitude, you can set up a local vertical coordinate system at each point and convert airspeed into north, east, up coordinates. Also, from the inertial velocity, you can do a numerical differentiation (acceleration=change in velocity/change in time) which is what I did to get the parachute graph above. You know the distance to the center of Mars and can therefore subtract off gravity and you are then left with non-gravitational accelerations generated by such things as drag, lift, engines, and resting on the ground. This non-gravitational acceleration is what the accelerometers feel. Also since you know the inertial velocity it is possible to set up a lift/drag local coordinate frame at each point to get lift and drag acceleration. With the inertial attitude provided by the attitude kernel, you can get angle of attack in both directions (and confirm that the entry vehicle is not spinning) and with the mass of the vehicle, you can get lift and drag force as a function of velocity and angle of attack along the entry corridor. You still need a Mars model atmosphere to get all the way to Cd and Cl, and this cannot be derived solely from the kernels.
So yeah, this data is enough to do some interesting aero models.
Event times, based on acceleration transients in most cases
Time from start of SPICE kernel, Event
0, SPICE kernel starts, 2008 May 25 23:30:57.920 UTC SCET, 3522.2km from center of Mars, (Entry interface, 125km above spherical reference surface)
15.202, 125km above ellipsoid (23:31:13.122 UTC SCET) (Interpolated)
122.955, Peak deceleration, 84.2403m/s^2
227.825, parachute firing
228.935, first peak parachute deceleration, 82.962m/s^2
242.825, heat shield jettison
252.985, leg deploy
253.485, leg deploy
253.980, leg deploy
404.940, lander separation
405.516, First thruster pulse, low thrust
408.005, First thruster pulse, high thrust
429, transition to constant velocity
431, constant velocity achieved, ~2.65m/s down
446.005, peak of touchdown transient, 52.666m/s^2, 23:38:23.925 UTC SCET, 430.804s after entry interface
452.860, SPICE kernel ends, 2008 May 25 23:38:30.780 UTC SCET
Edit: Entry interface is 125km above a spherical Mars reference surface, or 3522.2km from the center of Mars. I originally had entry interface 125km above ellipsoidal surface. It turns out that the spice kernel starts within 5ms of entry interface as properly defined. It is obvious that the kernel is intended to start exactly at entry interface.
Once you have the geodetic latitude and longitude, you can set up a local vertical coordinate system at each point and convert airspeed into north, east, up coordinates. Also, from the inertial velocity, you can do a numerical differentiation (acceleration=change in velocity/change in time) which is what I did to get the parachute graph above. You know the distance to the center of Mars and can therefore subtract off gravity and you are then left with non-gravitational accelerations generated by such things as drag, lift, engines, and resting on the ground. This non-gravitational acceleration is what the accelerometers feel. Also since you know the inertial velocity it is possible to set up a lift/drag local coordinate frame at each point to get lift and drag acceleration. With the inertial attitude provided by the attitude kernel, you can get angle of attack in both directions (and confirm that the entry vehicle is not spinning) and with the mass of the vehicle, you can get lift and drag force as a function of velocity and angle of attack along the entry corridor. You still need a Mars model atmosphere to get all the way to Cd and Cl, and this cannot be derived solely from the kernels.
So yeah, this data is enough to do some interesting aero models.
Event times, based on acceleration transients in most cases
CODE
Time from start of SPICE kernel, Event
0, SPICE kernel starts, 2008 May 25 23:30:57.920 UTC SCET, 3522.2km from center of Mars, (Entry interface, 125km above spherical reference surface)
15.202, 125km above ellipsoid (23:31:13.122 UTC SCET) (Interpolated)
122.955, Peak deceleration, 84.2403m/s^2
227.825, parachute firing
228.935, first peak parachute deceleration, 82.962m/s^2
242.825, heat shield jettison
252.985, leg deploy
253.485, leg deploy
253.980, leg deploy
404.940, lander separation
405.516, First thruster pulse, low thrust
408.005, First thruster pulse, high thrust
429, transition to constant velocity
431, constant velocity achieved, ~2.65m/s down
446.005, peak of touchdown transient, 52.666m/s^2, 23:38:23.925 UTC SCET, 430.804s after entry interface
452.860, SPICE kernel ends, 2008 May 25 23:38:30.780 UTC SCET
Edit: Entry interface is 125km above a spherical Mars reference surface, or 3522.2km from the center of Mars. I originally had entry interface 125km above ellipsoidal surface. It turns out that the spice kernel starts within 5ms of entry interface as properly defined. It is obvious that the kernel is intended to start exactly at entry interface.
From the parachute deployment, the tether seems to have a natural 0.7 sec oscillation wavelength. Looking at the leg deployment on the acceleration graph above, it almost seems that the leg deployment sequence timing might've augmented the oscillation and caused more of a yo-yoing than necessary.
Kinda like when you pump your legs on a swing set to go higher.
Probably not a big deal, but a future landing might could be made smoother with a different leg deployment delay to dampen the oscillation - like 0.3 sec.
-Mike
Kinda like when you pump your legs on a swing set to go higher.
Probably not a big deal, but a future landing might could be made smoother with a different leg deployment delay to dampen the oscillation - like 0.3 sec.
-Mike
QUOTE (kwan3217 @ Jul 31 2008, 06:27 PM)
fortran, but short and easy to translate
Who would ever want to translate code from such a wonderful language as fortran?

Thanks for your work on this, guys!
I'm a bit out of my element in this thread, but when I saw the .csv data series files I couldn't help but dive in and see if I could do anything with such easily accessible data. I'm hoping I can take the lat/long/alt data at face value. I started out trying to make a 3D plot of the descent, but settled for this anaglyph rendition of the trajectory.
Does this even appear to be close to what you folks would expect? If it is, I'd like to find a way to plot this above a rendering of the Martian globe. With the white background, it's a bit stark as anaglyphs go. It might appear more clearly to to those of you who can double-up on the density of your red/cyan filters.
Click to view attachment
The joys of 'plot' - a freeware app for OSX..
I have made a KMZ file to see what it look in 3D by using alt, long and alt datas.
http://www.db-prods.net/blog/?p=362
(a direct link to the KMZ at the bottom of the GG Maps visualizator).
But, there are data bellow the reference level and in Google Earth, we can't see the last piece of EDL.
http://www.db-prods.net/blog/?p=362
(a direct link to the KMZ at the bottom of the GG Maps visualizator).
But, there are data bellow the reference level and in Google Earth, we can't see the last piece of EDL.
What about cheating - just add 2.5k to every alt value.
Yes, but how? There are a huge quantity of numbers. 
QUOTE (CosmicRocker @ Aug 1 2008, 12:48 AM)
I'm hoping I can take the lat/long/alt data at face value.
FYI, the values are planetocentric coordinates of the "near point" on Mars from Phoenix. The SPICE library calls:
subpt_c("near point","MARS",et,"LT+S","PHX",scsubpt,&alt) ; // get Phoenix subpoint, IAU_MARS rectangular coords
reclat_c(scsubpt,&subrad,&sublon,&sublat) ; // convert to rectangular to latitudinal (radius, longtitude, latitude)
For Mars there's not a big difference between planetocentric and planetographic.
Last 55s or so of landing.
Altitude on black line, left axis.
X = blue, Y = red, Z = Green - velocity on right axis in km/sec
Note the brief -Z increase at seperation, then the gradual drop until the constant velocity phase at about 2.3m/sec
Altitude on black line, left axis.
X = blue, Y = red, Z = Green - velocity on right axis in km/sec
Note the brief -Z increase at seperation, then the gradual drop until the constant velocity phase at about 2.3m/sec
QUOTE (Ant103 @ Aug 1 2008, 04:46 AM)
I have made a KMZ file to see what it look in 3D by using alt, long and alt datas.
Love the link to the Google Earth view!
Here's another version of the CSV with the altitudes offset to be zero at touchdown:
PHX EDL CSV altitude corrected (4MB zip file)
FWIW , Excel '08 on my Mac can open the CSV In full - but asking it to plot anything is a death-sentence. So I just use Excel to generate a CSV containing the time I want and the fields I want, and use Plot to then..er..plot it
Doug
Doug
I was kind of curious about that altitude data. Is the offset due to the reference geoid (forgive the term!) used, a delta in the IMU data, a combination of both, or something else entirely? I'd have expected the rad alt data to trump this in any case.
QUOTE (jmknapp @ Aug 1 2008, 04:17 AM)
For Mars there's not a big difference between planetocentric and planetographic.
Remind me not to let you navigate my spacecraft.
jmknapp : thanks.
Your updated file is great, but, a little big
Can you make a version without so many lines? (about the same numbers of the first version, because Google Earth can't view a KML file with so many point)
Your updated file is great, but, a little big
Can you make a version without so many lines? (about the same numbers of the first version, because Google Earth can't view a KML file with so many point)
QUOTE (Ant103 @ Aug 1 2008, 10:01 AM)
jmknapp : thanks.
Your updated file is great, but, a little big
Can you make a version without so many lines? (about the same numbers of the first version, because Google Earth can't view a KML file with so many point)
Your updated file is great, but, a little big
Can you make a version without so many lines? (about the same numbers of the first version, because Google Earth can't view a KML file with so many point)
OK, here's one at one second intervals, so only ~500 lines:
PHX EDL CSV, zero alt at touchdown, 1 second steps (26K zip file)
QUOTE (nprev @ Aug 1 2008, 08:50 AM)
I was kind of curious about that altitude data. Is the offset due to the reference geoid (forgive the term!) used, a delta in the IMU data, a combination of both, or something else entirely? I'd have expected the rad alt data to trump this in any case.
Not sure, but I'd bet it's just the difference between the actual altitude and the reference geoid. According to the man page for subpt_c():
QUOTE
method is a short string specifying the computation method
to be used. The choices are:
In both cases, the intercept computation treats the
surface of the target body as a triaxial ellipsoid.
The ellipsoid's radii must be available in the kernel
pool.
to be used. The choices are:
"Near point" The sub-observer point is
defined as the nearest point on
the target relative to the
observer.
"Intercept" The sub-observer point is
defined as the target surface
intercept of the line
containing the observer and the
target's center.
In both cases, the intercept computation treats the
surface of the target body as a triaxial ellipsoid.
The ellipsoid's radii must be available in the kernel
pool.
In an early press conference someone mentioned that the plains Phoenix is on are quite low, such that liquid water can even exist, so it might make sense that it would be 2.7km below the geoid.
QUOTE (mcaplinger @ Aug 1 2008, 09:12 AM)
Remind me not to let you navigate my spacecraft.
Just going by this web page:
QUOTE
Planetocentric coordinates are referred to the equatorial plane of the body concerned and are much used in the calculations of celestial mechanics. Planetocentric longitude is measured around the equator of the body from a prime meridian defined and adopted by international agreement. (The prime meridian may be referred to a visible feature in the case of a solid-surfaced body such as Mars, but in the case of a gaseous planet such as Jupiter it is a purely hypothetical concept.) Planetocentric latitude is measured in an arc above or below the equator of the object in the usual way.
Planetographic coordinates are used for observations of the surface features of those planets whose figures are not truly spherical, but oblate. They are referred to the mean surface of the planet, and are the coordinates actually determined by observation. They can readily be converted to planetocentric coordinates if required. As the oblate planets are symmetrical about their axes of rotation, there is little difference in practice between planetocentric and planetographic longitudes. However, the differences between planetocentric and planetographic latitudes are quite significant for very oblate bodies such as Jupiter and Saturn.
Planetographic coordinates are used for observations of the surface features of those planets whose figures are not truly spherical, but oblate. They are referred to the mean surface of the planet, and are the coordinates actually determined by observation. They can readily be converted to planetocentric coordinates if required. As the oblate planets are symmetrical about their axes of rotation, there is little difference in practice between planetocentric and planetographic longitudes. However, the differences between planetocentric and planetographic latitudes are quite significant for very oblate bodies such as Jupiter and Saturn.
Again without having looked at the files, I recall from my pre-landing research for the countdown script that there was a regular mention of the landing site being at -2.5km to -3.5km MSL ... I always reckoned that it meant "mean surface level". Might reference to that. The simulator assumed a landing site altitude of MSL -3km, hence started entry interface at altitude 128 km (vertical above landing site).
Ooo how I would have loved having all these numbers PRIOR to the landing :-)
Ooo how I would have loved having all these numbers PRIOR to the landing :-)
QUOTE (jmknapp @ Aug 1 2008, 09:05 AM)
Just going by this web page:
I'd have to say that reference is a little questionable. For Mars an areocentric latitude can be almost 0.4 degrees different from an areographic one, which corresponds to a distance of over 20 km. It may not matter for what this thread is talking about, but there are plenty of times when it does.
A few close-ups of the accel during deployments etc.
Chute deploy, leg deploy, lander seperation, and touchdown.
Chute deploy, leg deploy, lander seperation, and touchdown.
QUOTE (djellison @ Aug 3 2008, 02:47 PM)
A few close-ups of the accel during deployments etc.
Chute deploy, leg deploy, lander seperation, and touchdown.
Chute deploy, leg deploy, lander seperation, and touchdown.
Weird how the acceleration pulses during the rocket-assisted descent--swinging from positive to negative, ten times a second.
QUOTE (mcaplinger)
For Mars an areocentric latitude can be almost 0.4 degrees different from an areographic one
Sure enough--difference of about 0.25 degree at the Phoenix landing site.
QUOTE (jmknapp @ Aug 3 2008, 09:39 PM)
Weird how the acceleration pulses during the rocket-assisted descent--swinging from positive to negative, ten times a second.
That's what pulse-throttling will do for you
Doug
QUOTE (djellison @ Aug 4 2008, 05:47 AM)
Chute deploy, leg deploy, lander seperation, and touchdown.
I notice one last peak of deceleration 0.35 seconds after landing ... did Phoenix bounce (a tiny little bit) on "impact"? To me the spike at L+0.35s does not seem to be part of a declining oscillations from the spacecraft vibrations
QUOTE (djellison @ Aug 3 2008, 09:47 PM)
A few close-ups of the accel during deployments etc.
and touchdown.
and touchdown.
Would those small wobbles in g after landing be connected to the venting?
QUOTE (Oersted @ Aug 4 2008, 11:03 AM)
Would those small wobbles in g after landing be connected to the venting?
Or damping of the legs? Is it a spring-damper system? In a sort of way the answer is that any real system is, so I suppose the landing legs should have some oscillatory decay as response to this impulse.
QUOTE (jmknapp @ Aug 1 2008, 06:35 PM)
OK, here's one at one second intervals, so only ~500 lines:
PHX EDL CSV, zero alt at touchdown, 1 second steps (26K zip file)
PHX EDL CSV, zero alt at touchdown, 1 second steps (26K zip file)
Many thanks! It works fine
.http://www.db-prods.net/blog/?p=362
Now, I can add informations like where the heatshield was released, where the parachute and the leg were deployed, etc.
 .
.
Now that would be interesting. Ditto the exact moment that HiRISE image swathed past Phoenix. From that, we can see how long between heatshield-sep and the image, thus how far the heatshield was away from the lander tells us how much more quickly is was falling.
If we just presume a flat surface - we can then surely extrapolate between these and figure out a rough trajectory for the heatshield. We have a trajectory for the lander, and we know the mass of the lander comapred to the backshell and chute, so we can thus estimate the speed at which the backshell landed - and extrapolat a trajectory for it as well
And bingo - we have all three, animated.
I've got a balloon to fly this w'end, and animations of a different sort to do - but if someone can do large images that show, to scale, the above-projection of these trajectories, the side projection of them, and the times - I could knock something quite simple up rather quickly - with the HiRISE image as a back-drop
Although " cette page du forum américain Unmannedspaceflight," isn't quite right. UMSF est un forum Britannique
Doug
If anybody is creating a very detailed timeline of EDL events, including possibly things like MRO MEX ODY activities, then I would be very grateful if you could share it ... I'd like to put it on my website where the realtime simulation used to be. I guess that'd be a fitting way to end the realtime simulation which incidentially still receives quite a number of hits.
If all else fails, I'll ultimately try and do it as well but that will be in the not-so-near future due to other commitments.
If all else fails, I'll ultimately try and do it as well but that will be in the not-so-near future due to other commitments.
QUOTE (dmuller @ Aug 4 2008, 06:24 AM)
I notice one last peak of deceleration 0.35 seconds after landing ... did Phoenix bounce (a tiny little bit) on "impact"? To me the spike at L+0.35s does not seem to be part of a declining oscillations from the spacecraft vibrations
Not sure to understand what it has been said after this post but, does it means that the "0.35 seconds after landing peak" could be the heatshield impact?
QUOTE (climber @ Aug 4 2008, 08:33 AM)
Not sure to understand what it has been said after this post but, does it means that the "0.35 seconds after landing peak" could be the heatshield impact?
I think the heatshield would have impacted well before the lander touched down, since it was free-falling.
Yeah - the heatshield would have been quite a lot earlier, and I doubt it would have been felt by the lander.
Maybe something to do with the prop system - not the He vent, but blow down of whatever was left in the engines perhaps.
I don't think it's a bounce - as that would have registered as the free-fall accel for a moment, which would be at a negative g number, as seen in-between the engine throttle pattern
Well, the three legs didn't touch down at the same instant--could that be it?
More CSV goodness, this time rotation matrices
As it says in the header, this includes position, velocity, rotation matrix from reference frame to lander cruise frame, and vector from Mars to Sun. Rate is exactly 24 frames per second. Perfect for all your animation needs, and in fact I am working on one, but I don't know if I will ever publish it, it's not yet Maas quality and I have high standards. But if I did want to post it, how would I?
This one is in the inertial MME frame (Like J2000, but aligned along the Mars polar axis). All distance units are meters (not km!) and all time units are seconds.
This one is in IAU Mars, which rotates with the surface of Mars.
Interesting things to notice:
1) The lander really swings under its parachute a lot, maybe ~20deg or so by my eye.
2) Wind is significant, especially towards the end of the parachute part. Wind backcast: From the north at 6m/s gusting to 14m/s
3) It seems that Phoenix oriented itself facing north almost perfectly. I can't see even a degree of difference between the sides of the spacecraft and local true north.
It's hard to find it and deduce it by seeing graphs and numbers in CSV, but, where can I find the exact time of EDL events and the time of MRO shot?
I agree with earlier suggestions that the heatshield would have impacted before the lander touchdown and probably didnt quite trigger an impact that Phoenix would have registered.
I am also not sure if it's the 3rd leg touching down late. Vertical speed was 2.4 m/s, and that spike was .35 secs after landing, so one side of Phoenix would have tilted up 2.4 x .35 = 84cm which would be a tilt of 10% or so (assumes a Phoenix diameter of 5 meters)
I am also not sure if it's the 3rd leg touching down late. Vertical speed was 2.4 m/s, and that spike was .35 secs after landing, so one side of Phoenix would have tilted up 2.4 x .35 = 84cm which would be a tilt of 10% or so (assumes a Phoenix diameter of 5 meters)
QUOTE (Ant103 @ Aug 4 2008, 08:34 AM)
It's hard to find it and deduce it by seeing graphs and numbers in CSV, but, where can I find the exact time of EDL events and the time of MRO shot?
I had a post earlier which has a timeline of all events visible from velocity or acceleration plots, relative to a certain UTC SCET time. I still don't know the time of the MRO shot, but now that we know the location history of the lander and MRO, maybe someone can reconstruct the image and back out the time.
Yes, I've seen it. But, the timeline is show as a duration from EDL begining. I need simple hours (hh:mm:ss) .
.
Ant, in this post the x-axis is given in time past a given UTC, you should be able to get some accurate times off that.
QUOTE (kwan3217 @ Aug 4 2008, 09:53 AM)
2) Wind is significant, especially towards the end of the parachute part. Wind backcast: From the north at 6m/s gusting to 14m/s
Ant103's Google Earth trajectory seems to show some wind effects, the trajectory wandering a bit towards the end:
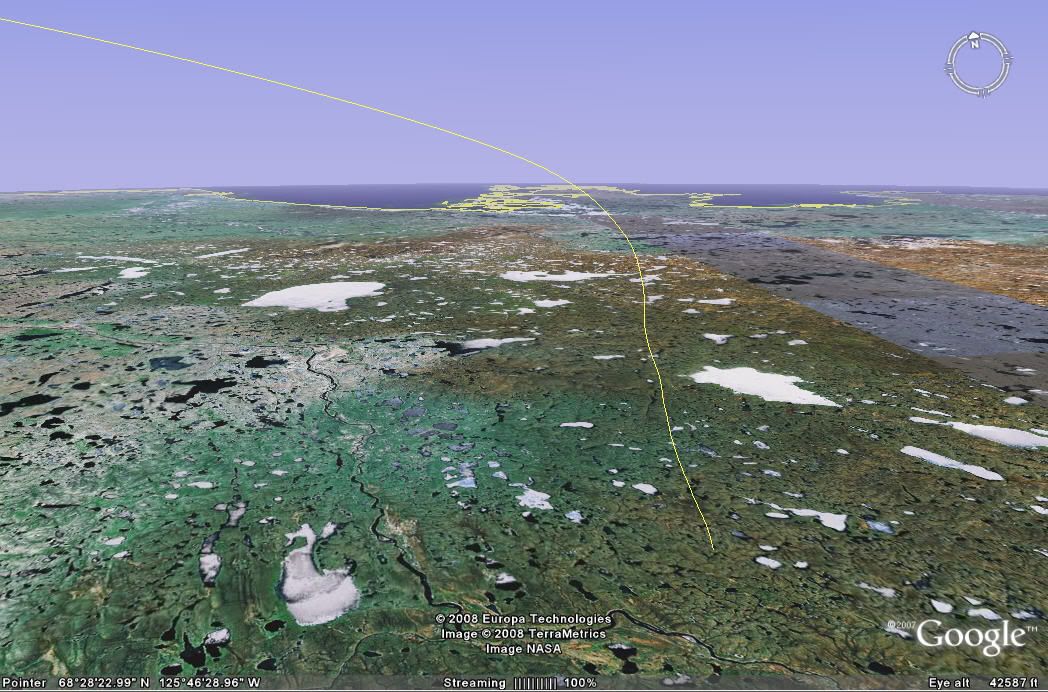
QUOTE (jamescanvin @ Aug 4 2008, 09:16 AM)
Ant, in this post the x-axis is given in time past a given UTC, you should be able to get some accurate times off that.
All the times in the timeline I posted are in seconds after that same UTC, 2008 May 25 23:30:57.920
QUOTE (jmknapp @ Aug 4 2008, 05:53 PM)
Ant103's Google Earth trajectory seems to show some wind effects, the trajectory wandering a bit towards the end:
Looking along the final decent path.
This is a "lo-fi" version of our main content. To view the full version with more information, formatting and images, please click here.